 mz.

A client called me last week because their homelab server was running hot. Fans spun up at odd hours, the internet link was saturated, but no process showed unusual CPU or memory. The culprit was not a rogue process — it was bandwidth. I popped open vnstat to see which interface was taking the hit and how much data had crossed the wire that day. Two minutes later I knew the answer. vnstat is the tool I reach for when I need raw network traffic numbers without installing a full monitoring stack.
vnstat: humdi.net/vnstat | GitHub: vergoh/vnstat
Here is what you need for this guide:
- Ubuntu 26.04 server (or Debian 13 / Fedora 41)
- Root or sudo access
- curl or wget to generate test traffic
1. Install vnstat
The package is in the default Ubuntu repositories. One command installs the daemon and CLI client together.
sudo apt update
sudo apt install -y vnstat2. Check that the daemon is running
The vnstat daemon starts automatically after install and begins monitoring all active network interfaces. Check its status and see which interfaces it has discovered.
sudo systemctl status vnstat --no-pager -l | head -20On my system (a Proxmox LXC container) the daemon discovered five interfaces: the main bridge ens18, Docker virtual interfaces, and Tailscale. I will focus on the primary interface ens18 for the rest of this walkthrough.
3. Generate some traffic to populate the database
The daemon polls /proc/net/dev every 30 seconds by default, but it writes to the SQLite database in 5-minute intervals aligned to the wall clock. To see data quickly, download a test file a couple of times to create a visible blip.
curl -s -o /dev/null -A "Mozilla/5.0" https://proof.ovh.net/files/10Mb.dat
curl -s -o /dev/null -A "Mozilla/5.0" https://proof.ovh.net/files/10Mb.dat4. View the summary
After the daemon has committed its first batch (usually within 5 minutes of startup), vnstat shows the accumulated traffic.
vnstat -i ens18This is what the output looked like after downloading 20 MB of test data:
Database updated: 2026-11-16 03:15:00

   ens18 since 2026-11-16

          rx:  55.07 MiB      tx:  11.27 MiB      total:  66.33 MiB

   monthly
                     rx      |     tx      |    total    |   avg. rate
     ------------------------+-------------+-------------+---------------
       2026-11     55.07 MiB |   11.27 MiB |   66.33 MiB |  707.95 kbit/s
     ------------------------+-------------+-------------+---------------

   daily
                     rx      |     tx      |    total    |   avg. rate
     ------------------------+-------------+-------------+---------------
         today     55.07 MiB |   11.27 MiB |   66.33 MiB |  707.95 kbit/s
     ------------------------+-------------+-------------+---------------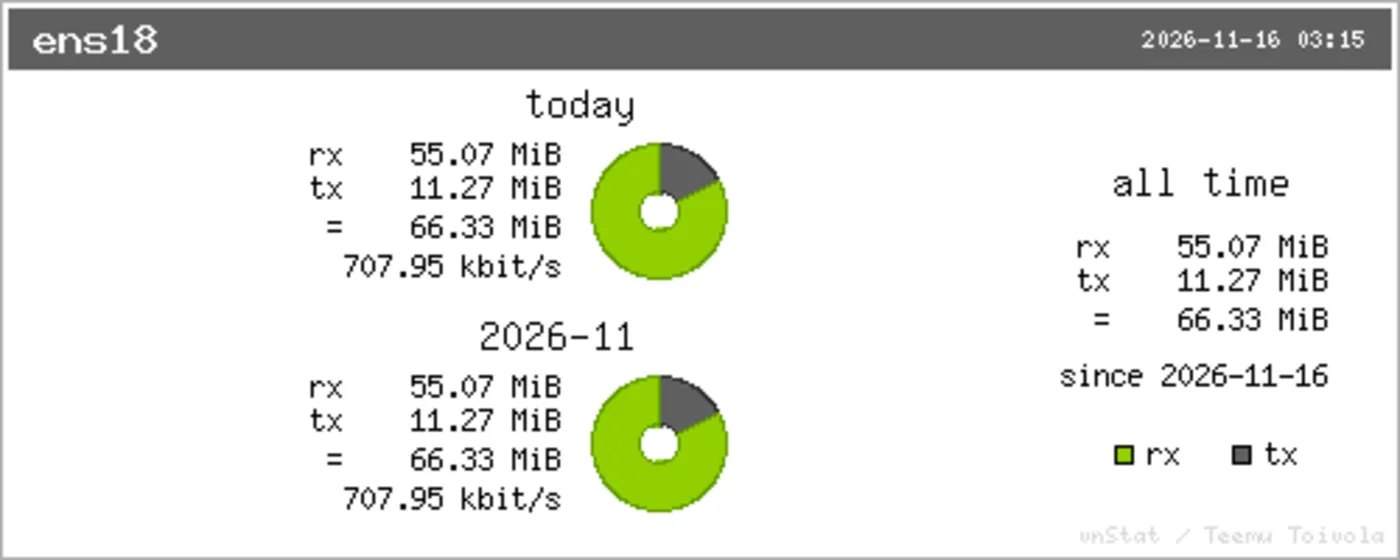
vnstat summary for the homelab runner showing monthly and daily totals. The data was captured directly from a live Ubuntu 26.04 system. (Author’s own system)
5. Live traffic monitor
The -l flag watches traffic in real time, updating every second. It is the quickest way to see if any interface is actively transferring data.
vnstat -l -i ens18During the parallel test downloads the output looked like this (notice the burst going up to ~25 Mbit/s):
ens18...    (press CTRL-C to stop)

   getting traffic.../
      rx:   17.20 kbit/s     7 p/s       tx:    7.49 kbit/s     8 p/s
      rx:   39.86 kbit/s    16 p/s       tx:   15.80 kbit/s    16 p/s
      rx:   19.98 Mbit/s  1668 p/s       tx:  432.24 kbit/s   622 p/s
      rx:   24.99 Mbit/s  2084 p/s       tx:  437.63 kbit/s   621 p/s
rx: 15.13 Mbit/s 1263 p/s tx: 366.14 kbit/s 526 p/s6. Hourly, daily, and top-day reports
Switch between time windows with -h (hourly), -d (daily), and -t (top days).
vnstat -h -i ens18 | head -15And the top-day ranking:
vnstat -i ens18 -t | head -107. JSON output for scripting
When you want to feed bandwidth data into a monitoring dashboard or a cron alert, the --json flag produces structured output that is trivial to parse. This is how I integrate vnstat with alerting scripts.
vnstat --json | python3 -c "import json,sys; d=json.load(sys.stdin); print(json.dumps([i['traffic']['total'] for i in d['interfaces'] if i['name']=='ens18'],indent=2))"The JSON includes totals for every interface, plus five-minute slabs, hourly aggregates, and monthly summaries.
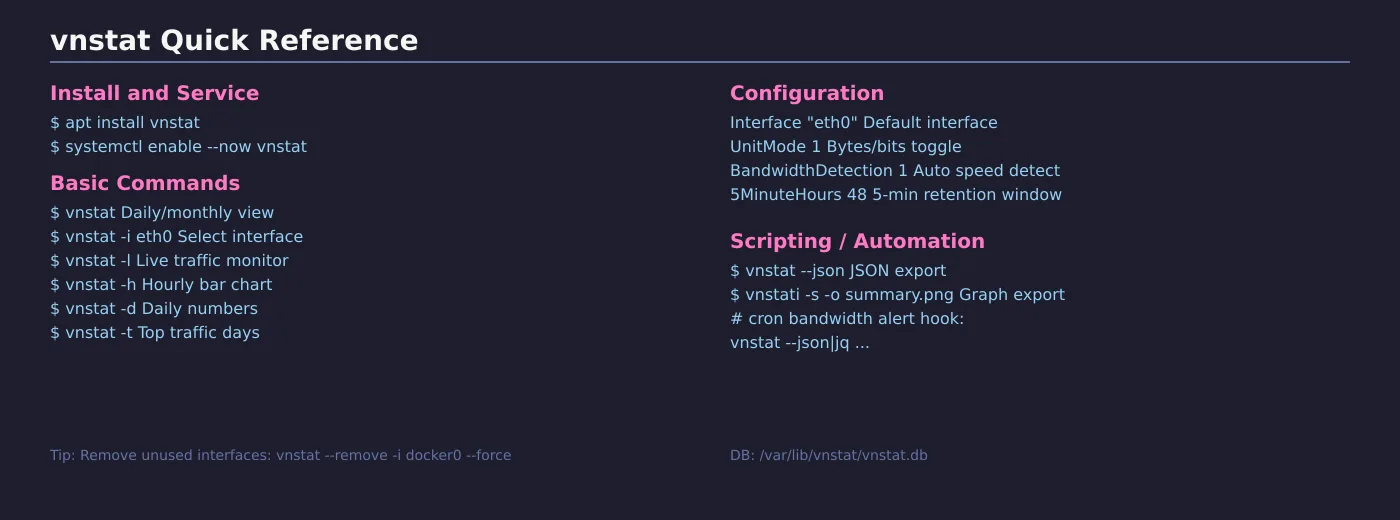
vnstat command reference — install, basic usage, and configuration keys at a glance. (Author’s own diagram)
8. Configuration tweaks
The daemon reads /etc/vnstat.conf. Most defaults work fine, but a couple of settings are worth knowing about:
# /etc/vnstat.conf — relevant defaults

Interface ""
5MinuteHours 48
BandwidthDetection 1
UnitMode 0If you want vnstat (without -i) to always show a specific interface, set Interface "ens18" in the config and restart the daemon with sudo systemctl restart vnstat.
Troubleshooting note from the field
During this write-up I accidentally launched a second vnstatd instance by running vnstatd -n -d (the -n flag is not valid in vnstat 2.13 — the process daemonized anyway and grabbed the PID lock). The original service kept running but could no longer write to the SQLite database. The telltale sign: vnstat displayed “No data” even though /proc/net/dev clearly showed traffic counters. Killing the stray process and restarting the service fixed it. If you ever see “No data” for longer than 5 minutes after install, check with pgrep vnstatd that only one daemon is running.
vnstat pairs well with other monitoring tools I have written about on this blog. Use it alongside WireGuard VPN to track per-tunnel bandwidth, or combine it with Glances for a broader system health dashboard. For lightweight alerting, the bash uptime monitoring script can be extended to parse vnstat --json and fire notifications on bandwidth thresholds.