 mz.

A worker unit on one of my boxes kept dying at odd hours and systemctl status always said the same thing: Result: core-dump. So the kernel dumped a core, right? When I ran coredumpctl list I got No coredumps found. Twice. The crash was real, the core was missing, and nobody anywhere was logging an error. That hunt taught me more about how systemd handles segfaults than I ever wanted to know, which makes it a perfect guide.
Docs I used: systemd-coredump(8), coredumpctl(1), and the systemd project page. Everything below was run on an Ubuntu 26.04 runner with systemd 259, and every output block is real captured terminal output.
How a Core Dump Actually Gets Stored
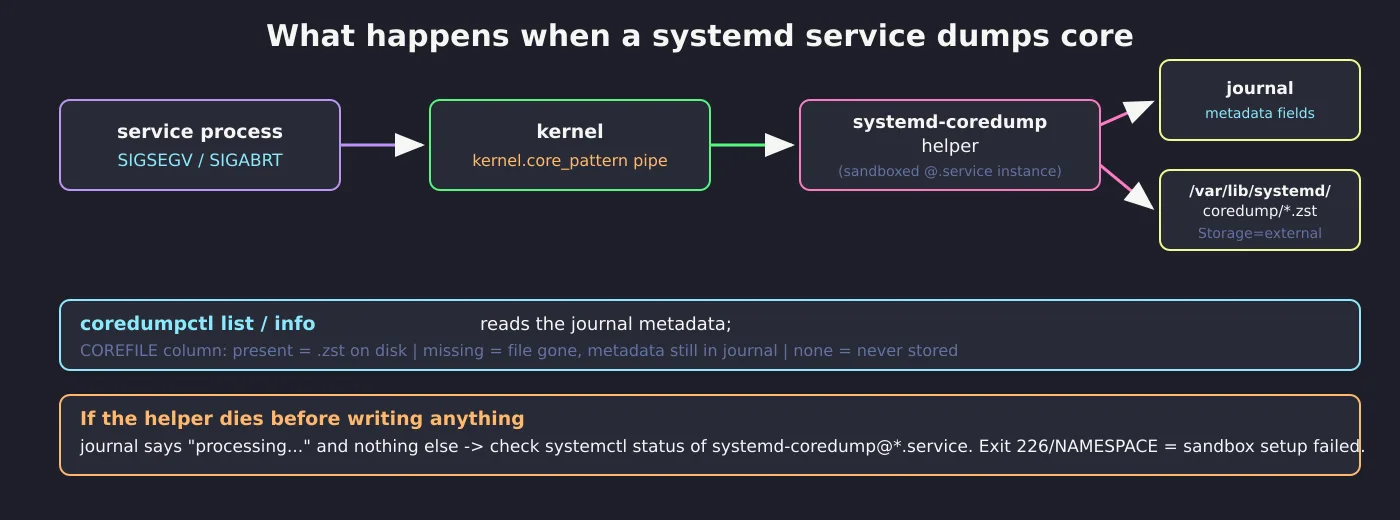
When a process dies from SIGSEGV or SIGABRT, the kernel does not write a file itself. It follows the kernel.core_pattern setting, and on any modern systemd box that is a pipe into a helper:
sysctl kernel.core_pattern
kernel.core_pattern = |/usr/lib/systemd/systemd-coredump %P %u %g %s %t %c %h %d %FSo every crashing process is streamed into systemd-coredump, which does two separate jobs. It writes journal metadata fields (that is all coredumpctl list reads), and it stores the compressed core file under /var/lib/systemd/coredump/ when Storage=external, the compiled default on this machine. Either half can fail independently, which is exactly how you end up with crashes that appear to have no cores.
The Demo: A Service That Crashes on Purpose
I need a crash with a known cause, so a 12-line C worker that dereferences a NULL pointer. Compile it with -g or the backtrace later will be address soup.
#include <stdio.h>
#include <unistd.h>

/* Demo worker: prints, sleeps, then dereferences a NULL
   pointer on the last line to trigger SIGSEGV. */
int main(int argc, char **argv) {
    char *cfg = NULL;
    printf("crashdemo pid=%d uid=%d starting work\n", getpid(), getuid());
    sleep(1);
    printf("loaded config: %s\n", cfg[0]);  /* boom: cfg is NULL */
    return 0;
}Wrap it in a minimal unit. Restart=no matters here, I want it to stay failed so I can read the state afterwards. If you are still deciding what else a unit file should set, my notes on systemd resource limits per service pair well with this.
[Unit]
Description=Crash demo worker

[Service]
Type=simple
ExecStart=/usr/local/bin/crashdemo
Restart=noRather than dropping a file into /etc/systemd/system, systemctl link registers the unit in place. Then start it and read the wreckage:
gcc -g -O0 -o /usr/local/bin/crashdemo crashdemo.c
systemctl link /tmp/coredump-lab/crashdemo.service
systemctl daemon-reload
systemctl start crashdemo
systemctl status crashdemo --no-pager -l
× crashdemo.service - Crash demo worker
     Loaded: loaded (/etc/systemd/system/crashdemo.service; linked; preset: enabled)
     Active: failed (Result: core-dump) since Sun 2026-11-22 03:02:23 UTC; 1s ago
   Duration: 1.054s
 Invocation: 5c92a6d3ed4042afb4795189edbee07c
    Process: 3313234 ExecStart=/usr/local/bin/crashdemo (code=dumped, signal=SEGV)
   Main PID: 3313234 (code=dumped, signal=SEGV)
   Mem peak: 2M
CPU: 7msDebugging note: gcc already told me about this bug at compile time. The warning format ‘%s’ expects argument of type ‘char *’, but argument 2 has type ‘int’ on the cfg[0] line is the crash. Warnings are crash reports you get in advance.
The Mystery: No Coredumps Found
Status says core-dump, so the kernel streamed the ELF into the helper. Time to collect it:
coredumpctl list --no-pager
No coredumps found.Nothing. No error either. Step one is looking at what the helper itself said:
journalctl -t systemd-coredump --no-pager --since ‘-10 min’
Nov 22 03:02:23 runner-int.zulfahmy.net systemd-coredump[3313245]: Process 3313234 (crashdemo) of user 0 terminated abnormally with signal 11/SEGV, processing...processing... and then silence. Normally the next line is dumped core plus the stack trace. When it never arrives, the suspect is the helper process itself, and every crash spawns its own systemd-coredump@NNN-... instance unit. That is where this was hiding:
systemctl status ‘systemd-coredump@142-737-3313847_7509285-0.service’ --no-pager -l
○ systemd-coredump@142-737-3313847_7509285-0.service - Process Core Dump (PID 3313847/UID 0)
     Loaded: loaded (/usr/lib/systemd/system/[email protected]; static)
    Active: inactive (dead) since Sun 2026-11-22 03:04:50 UTC; 51s ago
   Duration: 28ms
    Process: 3313848 ExecStart=/usr/lib/systemd/systemd-coredump (code=exited, status=226/NAMESPACE)
   Main PID: 3313848 (code=exited, status=226/NAMESPACE)

journalctl -u ‘systemd-coredump@142-737-3313847_7509285-0.service’ --no-pager -o cat
systemd-coredump@142-737-3313847_7509285-0.service: No devices matched by device filter.
Started systemd-coredump@142-737-3313847_7509285-0.service - Process Core Dump (PID 3313847/UID 0).
systemd-coredump@142-737-3313847_7509285-0.service: Failed to set up mount namespacing: /dev: No such file or directory
systemd-coredump@142-737-3313847_7509285-0.service: Failed at step NAMESPACE spawning /usr/lib/systemd/systemd-coredump: No such file or directory
Exit status 226/NAMESPACE means the sandbox for the helper could not be built. And [email protected] ships with a serious pile of hardening: PrivateDevices=yes, ProtectKernelLogs=yes, ProtectSystem=strict and more. This particular runner has a stripped /dev (only /dev/null exists, no /dev/kmsg, no /dev/zero), so mounting the fresh private /dev the sandbox expects fails before a single core byte is touched.
The fix is a drop-in that relaxes just the two directives this machine cannot honor:
mkdir -p /etc/systemd/system/[email protected]
cat > /etc/systemd/system/[email protected]/minimal-dev.conf <<EOF
[Service]
PrivateDevices=no
ProtectKernelLogs=no
EOF
systemctl daemon-reload
systemctl start crashdemo
Honest detour: my first guess was the classic one, that Storage=none was swallowing the cores, so I added a coredump.conf drop-in setting Storage=external. It changed nothing. On systemd 259 the compiled default is already external, and I only proved that by removing my placebo drop-in and crashing again: core stored. The sandbox failure was the whole story. Check the helper exit status before you start editing configs.
Reading the Crash: list and info
coredumpctl list --no-pager
TIME                            PID UID GID SIG     COREFILE EXE                       SIZE
Sun 2026-11-22 03:07:03 UTC 3314235 0 0 SIGSEGV present /usr/local/bin/crashdemo 16.7KThe COREFILE column is the summary of the whole post. present means the .zst sits on disk. missing means the journal metadata survived but the file is gone. none (or no row at all) means the helper never finished its job. For a single crash, info gives you everything without opening the binary:
coredumpctl info 3314235 --no-pager
           PID: 3314235 (crashdemo)
        Signal: 11 (SEGV)
     Timestamp: Sun 2026-11-22 03:07:02 UTC (18s ago)
  Command Line: /usr/local/bin/crashdemo
    Executable: /usr/local/bin/crashdemo
 Control Group: /system.slice/crashdemo.service
         Unit: crashdemo.service
      Storage: /var/lib/systemd/coredump/core.crashdemo.0.ac0e55bb7540456a9acc7555b9281f97.3314235.1795316822000000.zst (present)
  Size on Disk: 16.7K
       Message: Process 3314235 (crashdemo) of user 0 dumped core.

                Stack trace of thread 3314235:
                #0  0x00006221f53df1f9 main (crashdemo + 0x11f9)
                #1  0x00007d8408c2a601 __libc_start_call_main (libc.so.6 + 0x2a601)
                #2  0x00007d8408c2a718 __libc_start_main_impl (libc.so.6 + 0x2a718)
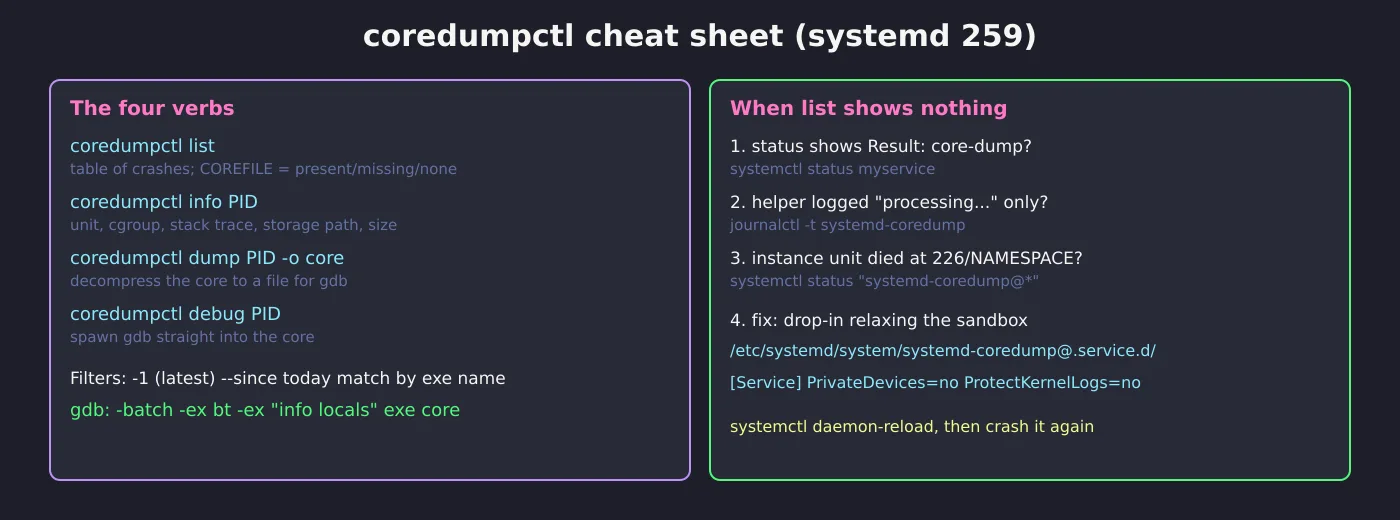
#3 0x00006221f53df0e5 _start (crashdemo + 0x10e5)Note the Unit: field. You can point at any PID, signal or binary name and info tells you which service it belonged to, which is how you match up a fleet of anonymous segfaulting workers without touching the core file at all. Filters worth knowing: -1 for the newest entry only and --since today, both verified on this machine. The full verb set on systemd 259 fits in one small table:
| Verb | What it does |
|---|---|
| list | Table of recorded crashes, COREFILE column included |
| info | Full metadata plus first stack trace for one match |
| dump | Decompress the core to stdout, or to a file with -o |
| debug | Spawn a debugger straight into the newest match |
Getting the Exact Line with gdb
coredumpctl debug is the one-liner, but for scripts and CI I pull the core out and feed gdb directly:
coredumpctl dump 3314235 --no-pager -o /tmp/coredump-lab/crash.core
-rw-r--r-- 1 root root 450560 Nov 22 03:07 /tmp/coredump-lab/crash.core

gdb -batch -ex bt -ex ‘info locals’ /usr/local/bin/crashdemo /tmp/coredump-lab/crash.core
Core was generated by `/usr/local/bin/crashdemo’.
Program terminated with signal SIGSEGV, Segmentation fault.
#0  0x00006221f53df1f9 in main (argc=1, argv=0x7fff246cf138) at /tmp/coredump-lab/crashdemo.c:10
10      printf("loaded config: %s\n", cfg[0]);  /* boom: cfg is NULL */
cfg = 0x0There it is: the source file, line 10, and cfg = 0x0 in the locals. One frame, no guessing. Two practical notes from the session. First, gdb on Ubuntu will ask about enabling debuginfod when the crash lands inside a system library; in batch mode it auto-answers no, so add set debuginfod enabled off to your .gdbinit if you script this. Second, the old coredumpctl gdb verb you will see in blog posts no longer exists on systemd 259, the help output lists only list, info, dump and debug. Use debug.
Retention and Cleanup
Cores compress well (16.7 KB for my toy process) but a real 2 GB service dumping core will fill a small /var fast. The volume guardrails live in /etc/systemd/coredump.conf: MaxUse and KeepFree cap total storage, ProcessSizeMax and ExternalSizeMax skip dumps that are too big to be worth keeping. On this build the defaults leave everything commented out with 32G caps. To trim by hand, note that v259 has no erase verb either. Delete the .zst files directly and the journal line survives with COREFILE missing, which is actually useful: you keep the crash inventory and lose the payload:
rm /var/lib/systemd/coredump/core.crashdemo.0.*3314235*
coredumpctl list --no-pager
TIME                            PID UID GID SIG     COREFILE EXE                      SIZE
Sun 2026-11-22 03:07:03 UTC 3314235 0 0 SIGSEGV missing /usr/local/bin/crashdemo -The metadata itself lives in the journal, so when the crash history is what you do not need anymore, the retention knobs from my write-up on auditing journald disk usage apply to coredump entries just like any other log records.
If your services report core-dump but coredumpctl stays empty, do not go hunting config files first. Read the exit status of the systemd-coredump instance unit. On hardened or containerized hosts it is almost always the sandbox, and one two-line drop-in ends the mystery.