 mz.

Uptime Kuma told me a container died. What it could not tell me was that the host had been bleeding memory for three straight weeks before that. That is Prometheus territory: pull every metric you can reach into a time-series database, then stare at graphs until patterns emerge. Here is how I stood up the full Prometheus + Grafana + node_exporter stack on my Ubuntu 26.04 homelab box, every command run and verified as I wrote this.
Official site: prometheus.io | grafana.com
GitHub: prometheus/prometheus | grafana/grafana

What you are installing
Three pieces, one job. Prometheus scrapes metrics endpoints over HTTP and stores them. node_exporter exposes CPU, memory, disk and network counters from a Linux box. Grafana draws the graphs and gives you dashboards. Ubuntu ships the first two in its own repo, and Grafana has an official apt repository. I also keep Uptime Kuma for up/down alerts: Prometheus answers the why, Kuma answers the whether.
Step 1: Install Prometheus and node_exporter
sudo apt update
sudo apt install -y prometheus prometheus-node-exporter
apt-cache policy prometheusOn my box that landed on Prometheus 2.53.5. Real output of the last command:
prometheus:
  Installed: 2.53.5+ds1-3
Candidate: 2.53.5+ds1-3One naming gotcha: the Debian package calls the service prometheus-node-exporter, not node_exporter. My first enable attempt failed:
sudo systemctl enable --now prometheus node_exporter
# Failed to enable unit: Unit node_exporter.service does not exist

sudo systemctl enable --now prometheus prometheus-node-exporter
systemctl is-active prometheus prometheus-node-exporter
# active
# activeStep 2: Confirm it is scraping itself
The stock config already scrapes Prometheus itself and the local node_exporter. Give it ~20 seconds, then ask the API:
curl -s http://localhost:9090/api/v1/targets | jq -r '.data.activeTargets[] | "\(.labels.instance)  \(.health)"'
# localhost:9100  up
# localhost:9090 upBoth targets green. If you get unknown instead of up, wait one more scrape interval (15s by default) before panicking. My earlier Nagios install walkthrough covers the alert-first style of monitoring, but Nagios only asks yes/no questions. Metrics are a different game.
Step 3: Install Grafana from the official repo
Do not use the snap. Grafana publishes a signed apt repo; set it up once and upgrades come through apt like everything else:
sudo mkdir -p /etc/apt/keyrings

curl -fsSL https://apt.grafana.com/gpg.key | sudo -S -p  gpg --dearmor -o /etc/apt/keyrings/grafana.gpg

echo "deb [signed-by=/etc/apt/keyrings/grafana.gpg] https://apt.grafana.com stable main" | sudo -S -p  tee /etc/apt/sources.list.d/grafana.list

sudo apt update
sudo apt install -y grafanaapt-cache policy grafana
# grafana:
# Installed: 13.3.0
# Candidate: 13.3.0Step 4: Start Grafana and set the admin password
sudo systemctl enable --now grafana-server

# first start takes ~15s before the web UI is ready
curl -s http://localhost:3000/api/healthReal health output once it woke up:
{
  "database": "ok",
  "version": "13.3.0",
  "commit": "6f8ce3c693b493043ebcd4787566d2b6b118b0f0"
}Grafana 12 and newer generate a random admin password on first boot instead of defaulting to admin/admin. The Ubuntu package did not log that password anywhere I could find, so I set one directly. Note the --homepath flag: without it the CLI resets a copy of the database the server is not using, and your login still fails:
sudo /usr/share/grafana/bin/grafana cli \
  --homepath /usr/share/grafana \
  --config /etc/grafana/grafana.ini \
admin reset-admin-password 'ChangeMe-Str0ng'Then log in at http://YOUR-SERVER:3000. Keep this port on the LAN only, see the firewall note at the end.
Step 5: Connect Grafana to Prometheus
You can click through Connection → Data sources, but provisioning files survive reinstalls and can live in git. One YAML, then restart Grafana:
apiVersion: 1
datasources:
  - name: Prometheus
    type: prometheus
    access: proxy
    url: http://localhost:9090
    isDefault: true
editable: true# after saving the file
sudo systemctl restart grafana-serverVerify the data source registered:
curl -s -u admin:ChangeMe-Str0ng http://localhost:3000/api/datasources | jq -r '.[] | "\(.name)  \(.type)  \(.url)"'
# Prometheus prometheus http://localhost:9090A query straight through the Grafana proxy proves both ends of the pipe at once:
curl -s -u admin:ChangeMe-Str0ng \
  "http://localhost:3000/api/datasources/proxy/uid/<UID>/api/v1/query?query=up" | jq '.data.result[].value[1]'
# 1
# 1
Step 6: Tune how long metrics are kept
The Ubuntu package runs Prometheus with a flat 15-day retention, which is short for spotting slow leaks. The flags live in /etc/default/prometheus, not in a systemd drop-in:
curl -s http://localhost:9090/api/v1/status/runtimeinfo | jq -r '.data.storageRetention'
# 15dSet it to 30 days (my 4 GB VM burns about 6 MB/hour of disk on two targets, so a month is cheap):
sudo sed -i 's/^ARGS=""/ARGS="--storage.tsdb.retention.time=30d"/' /etc/default/prometheus
sudo systemctl restart prometheus

curl -s http://localhost:9090/api/v1/status/runtimeinfo | jq -r '.data.storageRetention'
# 30dStep 7: Scrape your other machines
This is where the homelab pays off: install prometheus-node-exporter on every box, then add them as targets. Append a job to /etc/prometheus/prometheus.yml:
scrape_configs:
  # ... stock jobs kept above ...
  - job_name: 'homelab'
    static_configs:
      - targets: ['198.51.100.12:9100']
        labels:
host: 'fileserver'198.51.100.12 is a placeholder from the RFC 5737 documentation range, not a real host of mine. That is exactly why my test shows it down: no machine answers there. Swap in a real LAN address and it flips to up. Always validate before reloading:
promtool check config /etc/prometheus/prometheus.yml
# Checking /etc/prometheus/prometheus.yml
# SUCCESS: /etc/prometheus/prometheus.yml is valid prometheus config file syntaxThe gentle way to apply config is the reload endpoint, but it is disabled by default and the failure is quiet:
curl -s -X POST http://localhost:9090/-/reload
# Lifecycle API is not enabled.Turn it on in the same ARGS line, restart once, and reloads never need a service restart again:
# /etc/default/prometheus
ARGS="--storage.tsdb.retention.time=30d --web.enable-lifecycle"

sudo systemctl restart prometheus
# now: curl -X POST http://localhost:9090/-/reload  # silent 200, config applied

curl -s http://localhost:9090/api/v1/targets | jq -r '.data.activeTargets[] | "\(.labels.instance)  \(.health)"'
# 198.51.100.12:9100  down   (placeholder IP, no host behind it)
# localhost:9100       up
# localhost:9090 upDay one: three queries worth having
The Explore tab (compass icon) takes PromQL directly. CPU busy percentage, live from my test box:
100 * (1 - avg(rate(node_cpu_seconds_total{mode="idle"}[5m])))
# 5.54 (percent, measured on the Ubuntu 26.04 VM while writing this)Memory used percent:
100 * (1 - node_memory_MemAvailable_bytes / node_memory_MemTotal_bytes)And root disk free in GB:
node_filesystem_avail_bytes{mountpoint="/",fstype!~"tmpfs|overlay"} / 1024 / 1024 / 1024Put those three on a dashboard with a 6-hour window and you already know more about your servers than most people do about theirs. This is the chart my VM produced over its first hour of scraping, straight from query_range:
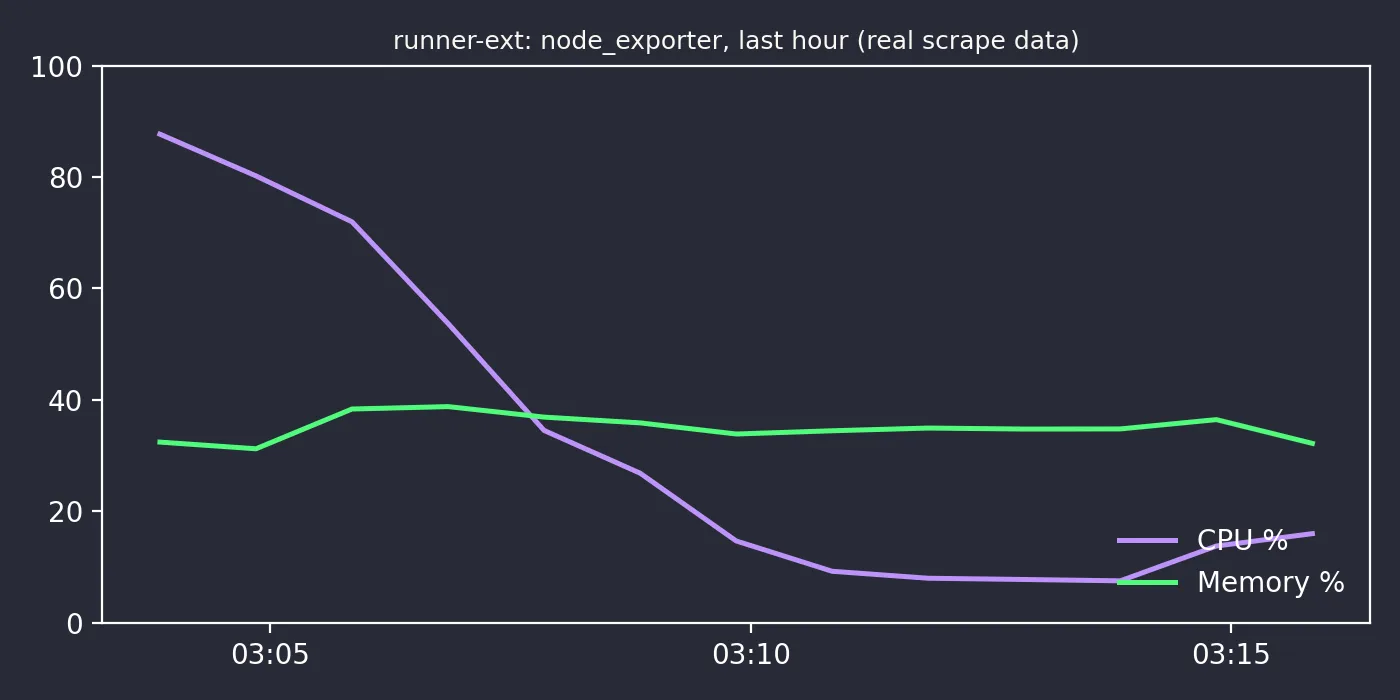
The purple spike in that capture is the Grafana package installing while Prometheus was watching. Monitoring discovering your backup jobs is a free insight you get on day one.
Firewall and remote scraping
Do not expose 3000 or 9090 to the internet. Keep both on the LAN with UFW, and if you scrape a box across the street or at your parents’ place, route the metrics through a VPN instead of opening ports:
sudo ufw allow from 192.168.1.0/24 to any port 9090 proto tcp
sudo ufw allow from 192.168.1.0/24 to any port 3000 proto tcpMy WireGuard VPN server guide covers the VPN side; node_exporter bound to the WireGuard address is reachable from the hub and invisible everywhere else. When a metric crosses a line often enough to page you, that is the next step: Alertmanager, which I will probably break in a separate post.