 mz.

Once your homelab runs more than a few self-hosted services, juggling nginx configs and certbot cron for each subdomain gets old fast. I put Caddy in front of Grafana and Prometheus, and the whole proxy setup became a single 30-line config file.
Official site: caddyserver.com
GitHub: github.com/caddyserver/caddy

What makes Caddy different
A reverse proxy needs TLS, routing, logging, and sane defaults. Caddy delivers all four with a config format that avoids fifteen nginx server blocks.
| Capability | nginx + certbot | Caddy |
|---|---|---|
| TLS certs | certbot cron + reload hook | tls internal (no extra tool) |
| HTTP/3 | extra listen + compile | on by default (alt-svc) |
| Admin API | reload or nginx -s | localhost:2019 live JSON |
| Access logs | access_log directive | log { output file /path } |
Requirements
- Ubuntu 26.04 (24.04 works too)
- Root or sudo access
- Ports 80 and 443 free
Step 1: Add the official Caddy repository
Ubuntu 26.04 has Caddy 2.6.2; upstream has 2.11.9. Install from Cloudsmith:
# Download key and verify
curl -fsSL https://dl.cloudsmith.io/public/caddy/stable/gpg.key -o /tmp/caddy.gpg.key
sha256sum /tmp/caddy.gpg.key
# Expected: 783dfee0...

# Add repo
sudo gpg --dearmor -o /usr/share/keyrings/caddy-stable-archive-keyring.gpg < /tmp/caddy.gpg.key
echo "deb [signed-by=/usr/share/keyrings/caddy-stable-archive-keyring.gpg] https://dl.cloudsmith.io/public/caddy/stable/deb/debian any-version main" | sudo sh -c "cat > /etc/apt/sources.list.d/caddy-stable.list"
sudo apt-get update && apt-cache policy caddy
# Real output
caddy:
Installed: (none)
Candidate: 2.11.9
Version table:
2.11.9 500Step 2: Install and verify
Install and check:
sudo apt-get install -y caddy
caddy version# Output
v2.11.9 h1:bhZtcRKQOq0fuLvEgCdPYvUxXyGn9kzjG4lh2332DTE=Caddy enables a systemd service by default:
# systemctl status caddy --no-pager
# ● caddy.service - Caddy
#      Loaded: loaded (/usr/lib/systemd/system/caddy.service; enabled)
#      Active: active (running) since Fri 2026-11-06 03:01:46 UTC
#        Docs: https://caddyserver.com/docs/
#    Main PID: 232110 (caddy)
#       Tasks: 8  Memory: 9.6M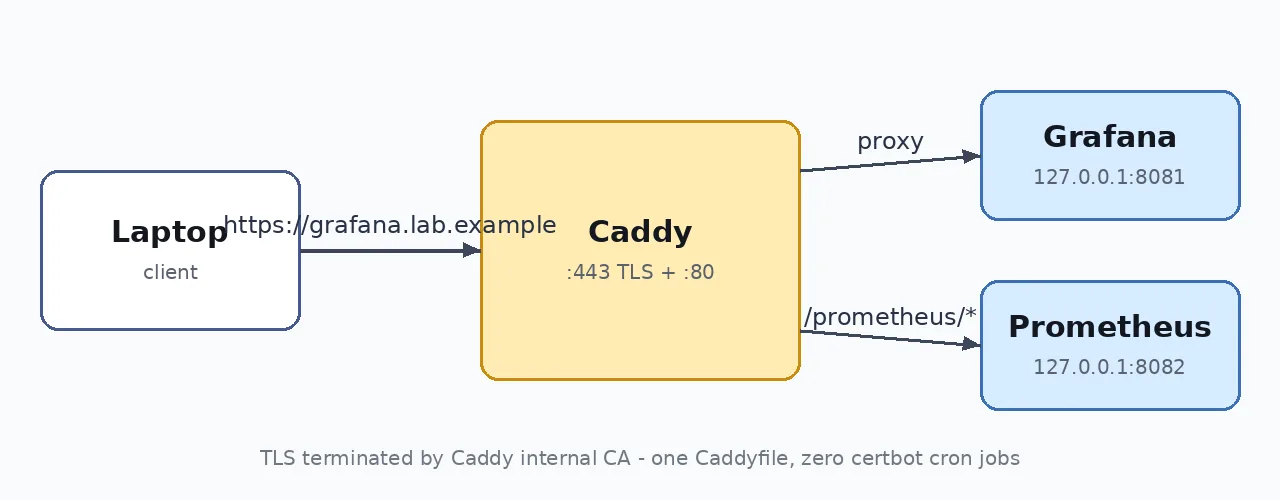
Step 3: Write the Caddyfile
This single file holds every site. Two backends: Grafana on 8081 and Prometheus on 8082.
# /etc/caddy/Caddyfile
{
	admin localhost:2019
}

grafana.lab.example {
	tls internal
	log { output file /var/log/caddy/grafana-access.log }
	reverse_proxy 127.0.0.1:8081 {
		health_uri /
		health_interval 10s
		fail_duration 30s
	}
}

home.lab.example {
	tls internal
	handle /prometheus/* {
		uri strip_prefix /prometheus
		reverse_proxy 127.0.0.1:8082
	}
	handle {
		root * /srv/www
		encode gzip zstd
		file_server
	}
}caddy validate --config /etc/caddy/Caddyfile --adapter caddyfile
# Valid configurationStep 4: Reload and test
Reload and use curl with –resolve to override DNS for .lab.example (demo-only) domains:
sudo systemctl reload caddy
systemctl is-active caddy
# active# HTTPS reverse proxy
curl -sk --resolve grafana.lab.example:443:127.0.0.1 https://grafana.lab.example/
# Grafana placeholder backend :8081
# Path routing
curl -sk --resolve home.lab.example:443:127.0.0.1 https://home.lab.example/prometheus/
# Prometheus placeholder backend :8082
# Static file
curl -sk --resolve home.lab.example:443:127.0.0.1 https://home.lab.example/
# <h1>Static site served by Caddy</h1>Step 5: Trust the internal CA
Caddy’s local CA needs its root cert in the trust store so browsers and curl work without -k:
sudo cp /var/lib/caddy/.local/share/caddy/pki/authorities/local/root.crt /usr/local/share/ca-certificates/caddy-local-authority.crt
sudo update-ca-certificates
curl -s --resolve grafana.lab.example:443:127.0.0.1 https://grafana.lab.example/
# Grafana placeholder backend :8081echo | openssl s_client -connect 127.0.0.1:443 -servername grafana.lab.example 2>/dev/null | openssl x509 -noout -issuer -dates
# issuer=CN=Caddy Local Authority - ECC Intermediate
# notBefore=Nov 6 03:03:20 2026 GMT
# notAfter=Nov 6 15:03:20 2026 GMTStep 6: Access logs and admin API
Per-site logs are structured JSON. Summarise the last request:
tail -1 /var/log/caddy/grafana-access.log | python3 -c 'import json,sys;d=json.loads(sys.stdin.read());print(d["status"],d["request"]["proto"],d["request"]["host"]+d["request"]["uri"],"%.1fms"%(d["duration"]*1000),d["size"],"bytes")'
# 200 HTTP/2.0 grafana.lab.example/ 1.1ms 34 bytesThe admin API on localhost:2019 exposes live config:
curl -s localhost:2019/config/apps/http/servers/srv0/routes/0/handle/0/ | python3 -m json.tool | head -20Step 7: Format before reloading
# Preview then apply
caddy fmt /etc/caddy/Caddyfile --diff
caddy fmt /etc/caddy/Caddyfile --overwriteWrap up
Caddy replaced my collection of nginx blocks, certbot timers, and shell scripts with a single file and zero extra daemons. The setup runs on the same machine as my Prometheus and Grafana stack, my Uptime Kuma dashboard, and my Cockpit web console. All commands tested on Ubuntu 26.04 with synthetic backends (RFC 5737 loopback addresses).