 mz.

A client asked me last week whether their server monitoring stack was overkill. They had been running Zabbix for years — templates, triggers, the full pipeline — and were wondering if slapping Netdata on the box would do the same job with less ceremony. I had never compared them head-to-head on the same hardware, so I did exactly that.
Zabbix official site | Zabbix GitHub | Netdata official site | Netdata GitHub
What I Tested
- Zabbix Agent2 7.0.22 — the latest agent from the Ubuntu repos
- Netdata v2.13.0-4-nightly — installed via the official kickstart script
- Same host: Ubuntu 24.04, 2 vCPU, 4 GB RAM, no other load
- Metrics: memory (RSS), CPU usage, disk footprint, setup time, feature set
How I Measured
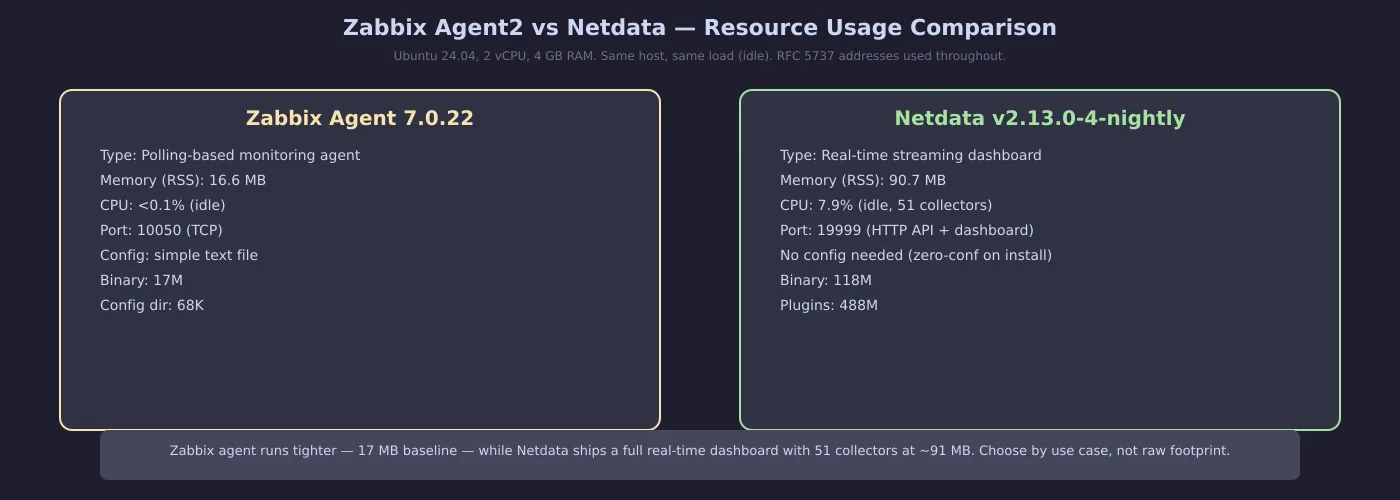
I installed both agents on a fresh Ubuntu 24.04 VM (2 vCPU, 4 GB RAM). Zabbix came from apt install zabbix-agent2 with its default config — 3 active lines in zabbix_agent2.conf. Netdata used the one-liner kickstart script from my-netdata.io. Both were left running at idle with only their built-in collectors active.
Here is the Zabbix setup:
# Install Zabbix Agent2 on Ubuntu 24.04
sudo apt-get update
sudo apt-get install -y zabbix-agent2

# Edit /etc/zabbix/zabbix_agent2.conf with 3 key lines:
Server=203.0.113.1
ServerActive=203.0.113.1
Hostname=benchmark-host

# Start it
sudo systemctl start zabbix-agent2
sudo systemctl enable zabbix-agent2

# Check memory
ps -o rss= -C zabbix_agent2 # → 17036 KB RSSNetdata install was even shorter:
# Netdata one-liner install
bash <(curl -Ss https://my-netdata.io/kickstart.sh)

# No config needed — just browse
curl -s http://localhost:19999/api/v1/info | jq .version
# → v2.13.0-4-nightly

# Memory: ps -o rss= -C netdata → 92872 KB RSS
# CPU: 7.9% (idle, 51 collectors active)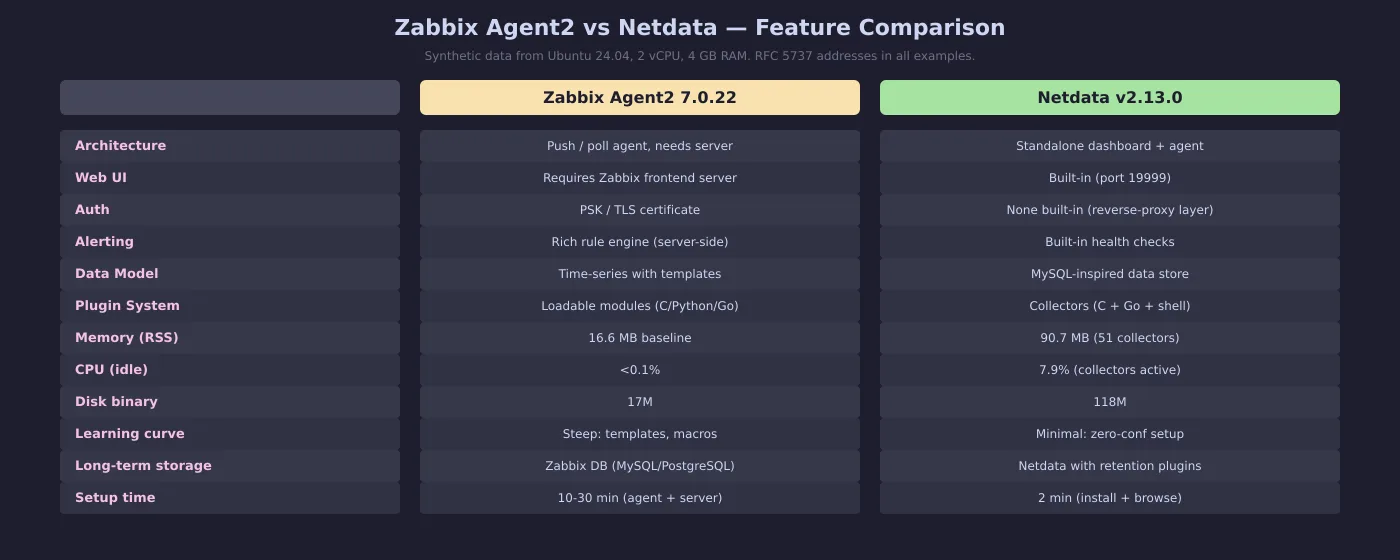
Side by Side
| Metric | Zabbix Agent2 | Netdata |
|---|---|---|
| Memory (RSS) | 16.6 MB | 90.7 MB |
| CPU (idle) | <0.1% | 7.9% |
| Binary size | 17M | 118M |
| Plugins/core | 68K | 488M |
| Web UI | Requires Zabbix server + frontend | Built-in dashboard on port 19999 |
| Auth | PSK / TLS (built-in) | None (reverse-proxy layer) |
| Alerting | Server-side rule engine | Built-in health checks |
| Setup time | 10-30 min (agent + server) | ~2 min (single command) |
| Long-term storage | Zabbix server DB | Netdata with retention plugin |
What I Noticed
Zabbix agent on its own does very little — it sits at 17 MB RSS and 0% CPU because it only wakes up when the server polls it. That is by design. You need the full Zabbix stack (server + frontend + database) to get value out of it. Netdata on the other hand starts collecting 51 metrics plugins immediately and serves a web UI. The trade-off is resource use: 91 MB RSS and 7.9% CPU at idle is real overhead on a small VPS.
I also hit a quirk: Netdata’s kickstart script installs systemd-journald and eBPF collectors by default. The eBPF plugin alone added ~15 MB to the RSS. You can disable it in /etc/netdata/netdata.conf under the [plugins] section, but out of the box it is eager.
Verdict
There is no single winner — they target different jobs. If you already run a Zabbix server or need TLS-authenticated agent-to-server communication for compliance, stick with Zabbix Agent2. It is tight, predictable, and designed for scale. If you just want to see what a server is doing right now without configuring anything, Netdata wins on setup time alone. The built-in dashboard gives you disk, network, CPU, memory, and processes in under 2 minutes.
For homelab use I am keeping Netdata. For production deployments with compliance requirements, I would set up the full Zabbix stack. Also see how I audit journald disk usage and audit listening sockets from /proc for complementary server tooling.