 mz.

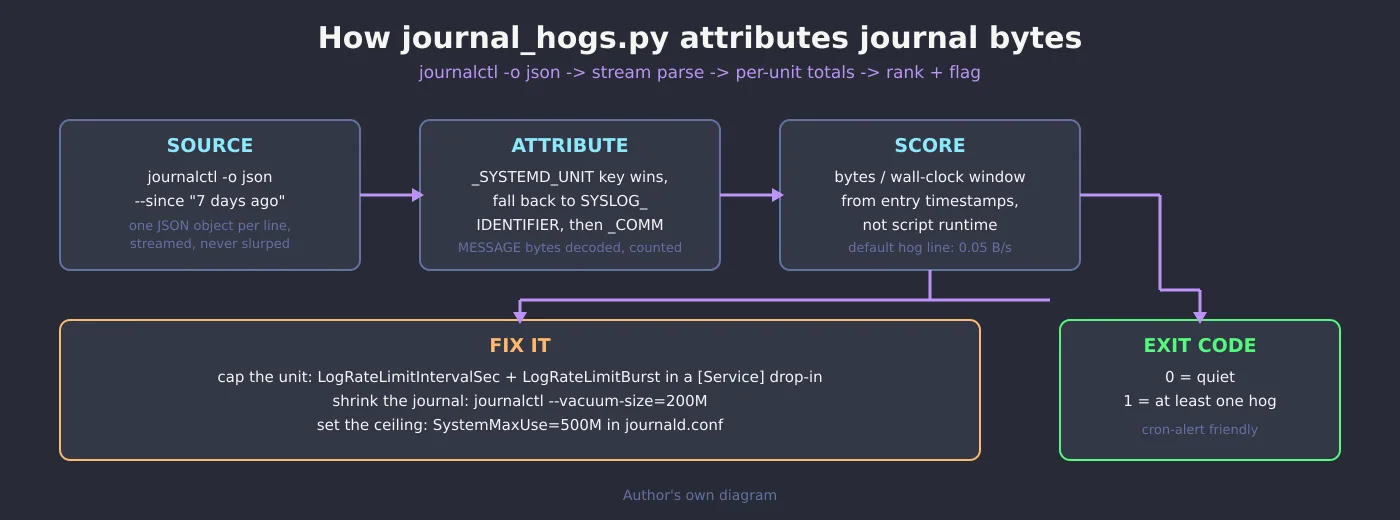
A while back my SSH box reported “Archived and active journals take up 98.5M” and that was it. Not one command tells you which service wrote those 98 megabytes. So I wrote journal_hogs.py: it streams the journal once, attributes every byte to its unit, ranks the talkers, and exits non-zero when one of them is spamming.
Official docs: systemd.io · systemd-journald(8) man page · GitHub (systemd/systemd)
Why –disk-usage is a dead end
journalctl --disk-usage prints one number for the whole journal. Journal files are compressed on disk, so even that number hides the real text volume. There is no built-in per-unit accounting: journalctl -u something counts entries for one unit you already suspect, which is useless when you are asking who to suspect. What we do have is journalctl -o json: every entry as one JSON line, with a _SYSTEMD_UNIT field on almost all of them. Stream that, sum MESSAGE byte lengths per unit, divide by the wall-clock window the entries span, done.
The script
Pure standard library, Python 3.8 and up, works over rotated archived journals because journalctl merges them for you. The --json flag and the exit codes are there so you can drop it into cron or a monitoring check later.
#!/usr/bin/env python3
"""journal_hogs.py - attribute journald growth to systemd units.

Streams journalctl JSON output, sums payload bytes per unit, ranks the
noisiest writers, flags hogs by bytes/sec, and prints vacuum advice.
Read-only unless --vacuum is passed.
"""
import argparse
import base64
import collections
import json
import re
import subprocess
import sys
from datetime import datetime


def entry_bytes(entry):
    msg = entry.get("MESSAGE", b"")
    if isinstance(msg, str):
        m = re.fullmatch(r"y([A-Za-z0-9+/=]*)", msg)
        if m:
            msg = base64.b64decode(m.group(1))
        else:
            msg = msg.encode("utf-8", "replace")
    return len(msg)


def unit_of(entry):
    return (entry.get("_SYSTEMD_UNIT")
            or entry.get("SYSLOG_IDENTIFIER")
            or entry.get("_COMM")
            or "[no unit]")


def stream(since, until, unit):
    cmd = ["journalctl", "-o", "json", "--no-pager", "-q"]
    if since:
        cmd += ["--since", since]
    if until:
        cmd += ["--until", until]
    if unit:
        cmd += ["_SYSTEMD_UNIT=" + unit]
    proc = subprocess.Popen(cmd, stdout=subprocess.PIPE,
                            stderr=subprocess.DEVNULL, text=True)
    for line in proc.stdout:
        line = line.strip()
        if line:
            yield json.loads(line)
    proc.wait()


def main():
    ap = argparse.ArgumentParser(description="rank journald writers per unit")
    ap.add_argument("--since", default="7 days ago")
    ap.add_argument("--until", default=None)
    ap.add_argument("--unit", default=None, help="filter one unit")
    ap.add_argument("--top", type=int, default=15)
    ap.add_argument("--hog-mbps", type=float, default=0.05,
                    help="bytes/sec threshold to flag a unit (default 0.05)")
    ap.add_argument("--json", action="store_true", help="machine output")
    args = ap.parse_args()

    t0 = datetime.now()
    stats = collections.defaultdict(
        lambda: {"bytes": 0, "entries": 0, "samples": {}})
    total_bytes = 0
    total_entries = 0
    min_ts = None
    max_ts = None

    for entry in stream(args.since, args.until, args.unit):
        u = unit_of(entry)
        b = entry_bytes(entry)
        stats[u]["bytes"] += b
        stats[u]["entries"] += 1
        if len(stats[u]["samples"]) < 3:
            raw = entry.get("MESSAGE", "")
            if isinstance(raw, str) and raw.startswith("y") and not raw[1:2].isalnum():
                raw = raw[:80]
            stats[u]["samples"].setdefault(
                raw.encode("utf-8", "replace")[:120].decode("utf-8", "replace"), 0)
        total_bytes += b
        total_entries += 1
        ts = entry.get("__REALTIME_TIMESTAMP")
        if ts:
            ts = int(ts) / 1_000_000
            min_ts = ts if min_ts is None else min(min_ts, ts)
            max_ts = ts if max_ts is None else max(max_ts, ts)

    window = max((max_ts or 0) - (min_ts or 0), 1.0)

    ranked = sorted(stats.items(), key=lambda kv: kv[1]["bytes"], reverse=True)
    hogs = [(u, s) for u, s in ranked
            if s["bytes"] / window > args.hog_mbps]

    disk = subprocess.run(["journalctl", "--disk-usage"],
                          capture_output=True, text=True).stdout.strip()

    if args.json:
        out = {"window_seconds": round(window),
               "total_bytes": total_bytes, "total_entries": total_entries,
               "disk": disk,
               "units": [{"unit": u, "bytes": s["bytes"],
                          "entries": s["entries"],
                          "bps": round(s["bytes"] / window, 4),
                          "pct": round(100 * s["bytes"] / max(total_bytes, 1), 2)}
                         for u, s in ranked]}
        print(json.dumps(out, indent=2))
        sys.exit(1 if hogs else 0)

    print(disk)
    print(f"window: {window/3600:.1f} h | entries: {total_entries:,} | "
          f"payload: {total_bytes/1_048_576:.1f} MiB | "
          f"elapsed: {(datetime.now()-t0).total_seconds():.1f}s")
    print()
    print(f"{'UNIT':<38}{'ENTRIES':>10}{'SIZE':>10}{'%':>7}{'B/s':>8}")
    for u, s in ranked[:args.top]:
        pct = 100 * s["bytes"] / max(total_bytes, 1)
        size = (f"{s['bytes']/1_048_576:.1f}M" if s["bytes"] >= 1_048_576
                else f"{s['bytes']/1024:.0f}K")
        print(f"{u:<38}{s['entries']:>10,}{size:>10}{pct:>6.1f}%"
              f"{s['bytes']/window:>8.3f}")
    print()
    if hogs:
        print("FLAGGED (above --hog-mbps=" + str(args.hog_mbps) + "):")
        for u, s in hogs:
            sample = next(iter(s["samples"]), "")
            print(f"  {u}  [{sample[:70]}]")
        print()
        print("fix: cap the unit with a drop-in, then shrink the journal:")
        print("  systemctl edit    # add RateLimitIntervalSec / LogLevel")
        print("  journalctl --vacuum-size=200M")
        sys.exit(1)
    print("no unit exceeded the rate threshold")
    sys.exit(0)


if __name__ == "__main__":
    main()
The first real run found a mess
This is my actual runner (Ubuntu 26.04, systemd 259), a quiet box that should log almost nothing:
python3 journal_hogs.py --since "7 days ago" --top 12Archived and active journals take up 90M in the file system.
window: 165.6 h | entries: 176,299 | payload: 33.4 MiB | elapsed: 9.7s
UNIT ENTRIES SIZE % B/s
rsyslog.service 171,500 33.0M 99.0% 58.067
log-flood-demo.service 2,382 113K 0.3% 0.194
init.scope 921 78K 0.2% 0.134
ntfy.service 146 37K 0.1% 0.063
kernel 345 30K 0.1% 0.052
containerd.service 78 15K 0.0% 0.026
docker.service 41 10K 0.0% 0.017
networkd-dispatcher.service 92 9K 0.0% 0.015
tailscaled.service 76 7K 0.0% 0.011
udisks2.service 104 7K 0.0% 0.011
NetworkManager.service 54 5K 0.0% 0.009
systemd-coredump 54 5K 0.0% 0.009
FLAGGED (above --hog-mbps=0.05):
rsyslog.service [rsyslogd: file '/var/log/syslog'[7] write error - see https://www.rsys]
log-flood-demo.service [synthetic demo line 1 worker=pool-3 queue=jobs]
init.scope [var-lib-containerd-tmpmounts-containerd\x2dmount2661837370.mount: Deac]
ntfy.service [INFO Server stats (emails_received=0, emails_received_failure=0, email]
kernel [br-d3d8431f83a5: port 1(veth92ad328) entered disabled state]
fix: cap the unit with a drop-in, then shrink the journal:
systemctl edit # add RateLimitIntervalSec / LogLevel
journalctl --vacuum-size=200M
exit=1That 99.0% on rsyslog was the finding. Drilling in with journalctl -u rsyslog.service -n 6 showed a write-error loop: file /var/log/syslog write error, OS error: No space left on device. The root disk had briefly hit 95% full, rsyslog could not write its action output, and it logged the failure pair over and over, about 171,500 entries in two days, straight into the journal. The loop ended by itself when space freed up, but nobody would have noticed without the byte ranking: nothing was crashing, so every health check stayed green.
Seeing the flagging with synthetic noise
To test the hog-flagging path I generated synthetic traffic: a throwaway systemd-run unit writing 30,000 lines of made-up worker chatter. No real data involved, the pool-3 queue names are invented for the demo.
systemd-run --unit=log-flood-demo --collect bash -c 'for i in $(seq 1 30000); do echo "synthetic demo line $i worker=pool-3 queue=jobs"; done'
python3 journal_hogs.py --since "1 hour ago" --top 6Archived and active journals take up 95.7M in the file system.
window: 1.0 h | entries: 22,600 | payload: 1.1 MiB | elapsed: 1.3s
UNIT ENTRIES SIZE % B/s
log-flood-demo.service 22,382 1.1M 98.0% 307.531
ntfy.service 60 15K 1.4% 4.327
init.scope 92 5K 0.5% 1.532
cron.service 9 1K 0.1% 0.187
rl-test.service 40 0K 0.0% 0.142
udisks2.service 4 0K 0.0% 0.072
FLAGGED (above --hog-mbps=0.05):
log-flood-demo.service [synthetic demo line 1 worker=pool-3 queue=jobs]
ntfy.service [INFO Server stats (emails_received=0, emails_received_failure=0, email]
init.scope [Starting fwupd-refresh.service - Refresh fwupd metadata and update mot]
cron.service [pam_unix(cron:session): session opened for user root(uid=0) by root(ui]
rl-test.service [flood line 1]
udisks2.service [Error statting /dev/dm-1\040(deleted): No such file or directory]
fix: cap the unit with a drop-in, then shrink the journal:
systemctl edit # add RateLimitIntervalSec / LogLevel
journalctl --vacuum-size=200M
exit=122,382 entries, 98% of the hour of bytes, flagged at 307 bytes per second. That is the shape of the output you use to aim the fix.
Stopping the noise
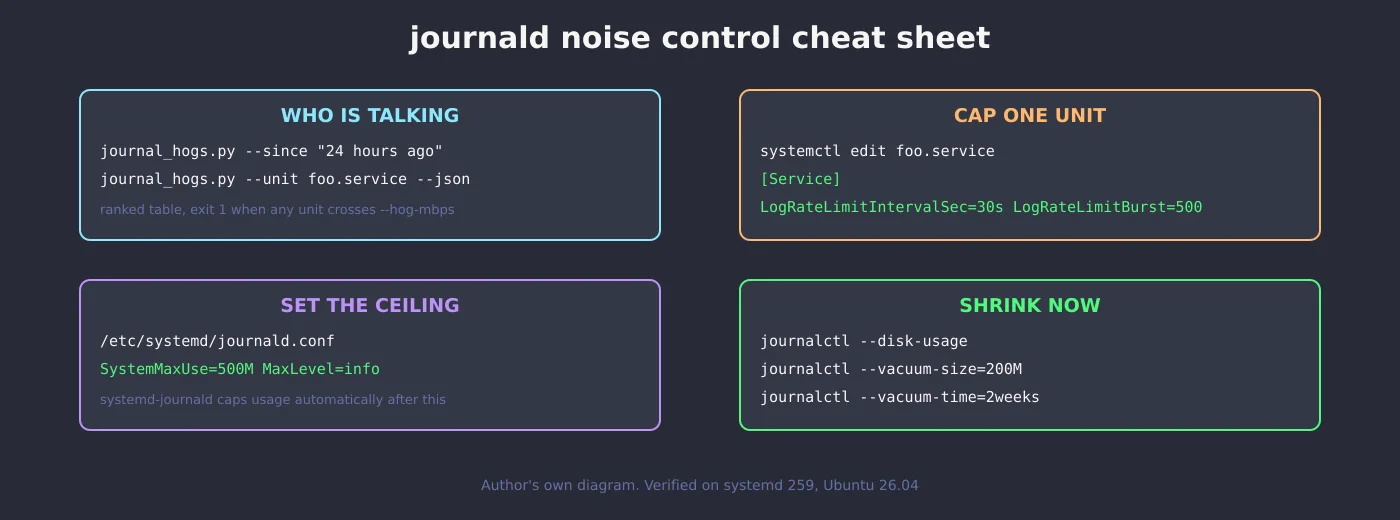
systemd gained per-unit journal rate limits, and I verified them live on 259: the same 3,000-line flood under a burst cap keeps 85 entries, the rest is dropped.
systemd-run -p LogRateLimitIntervalSec=10s -p LogRateLimitBurst=20 --unit=rl-test bash -c 'for i in $(seq 1 3000); do echo "flood line $i"; done'

lines written: 3000
journal entries kept:
$ journalctl -u rl-test --no-pager | wc -l
85For a real service the same two keys go in a drop-in. One gotcha I hit while testing: on systemd 259 the keys must sit in the [Service] section. I put them under [Unit] first and systemctl show kept reporting the inherited default of 0, silently. In systemctl edit myservice.service:
[Service]
LogRateLimitIntervalSec=30s
LogRateLimitBurst=500Keeping the journal small forever
# vacuum what is already there
journalctl --vacuum-size=200M

# or set the ceiling so journald self-trims from now on
# /etc/systemd/journald.conf -> [Journal]
SystemMaxUse=500MIf your box still keeps plain text logs next to the journal, find the logs logrotate misses first, this script only sees what goes through journald. And before adding more timers, audit your cron and systemd timer hygiene so the noise you chase is not your own 5-minute check-ins.
The cron hook
*/60 * * * * root /usr/local/bin/journal_hogs.py --since "6 hours ago" --json > /tmp/journal-report.json 2>> /tmp/journal-report.err || /usr/local/bin/alert.sh "$(jq -r '[.units[] | select(.bps > 0.05) | .unit] | join(", ")' /tmp/journal-report.json)"Exit code 1 means at least one unit crossed --hog-mbps, so the cron line alerts with just the unit names. For a full resource-cap picture beyond logs, the systemd resource limits per service write-up covers the CPU and memory side of the same drop-in workflow.
One streaming pass, no parsing of human output, and you always end up with the number that --disk-usage should have carried in the first place: who to tell to shut up.