 mz.

I found out last month that my NAS had been offline for two full days, and only because I went to fetch a file from it. Something needed to watch the LAN services, and I did not want another container for five endpoints. So I wrote 75 lines of bash instead.
Telegram Bot API: core.telegram.org/bots/api
curl: curl.se/docs
The problem with simple ping scripts
The naive version is a curl loop that sends a Telegram message on every failed check. On a five minute cron that is 288 alerts a day for one broken device, and by day two you mute the bot and the monitor is dead anyway. The script below fixes this with a single rule: alert on state change, never on state.
The target file
One line per service, name and URL, hash for comments. It follows the same file-driven pattern as my TLS certificate expiry checker. This is the exact file the demo used, two sandbox servers and one closed port. The data is synthetic, no real gear involved:
# name,url
jellyfin,http://127.0.0.1:8091/
gitea,http://127.0.0.1:8092/
nas-web,http://127.0.0.1:8093/The script
#!/usr/bin/env bash
# uptime-check.sh - ping endpoints from a CSV, alert only on state changes.
set -u

TARGETS_FILE="${TARGETS_FILE:-/etc/uptime-check/targets.csv}"
STATE_FILE="${STATE_FILE:-/var/tmp/uptime-check.state}"
BOT_TOKEN="${TELEGRAM_BOT_TOKEN:-}"
CHAT_ID="${TELEGRAM_CHAT_ID:-}"
TELEGRAM_API="${TELEGRAM_API:-https://api.telegram.org}"
CONNECT_TIMEOUT="${CONNECT_TIMEOUT:-5}"
MAX_TIME="${MAX_TIME:-10}"

log() { printf "%(%Y-%m-%d %H:%M:%S)T %s\n" -1 "$*"; }

notify() {
    if [[ -n "$BOT_TOKEN" && -n "$CHAT_ID" ]]; then
        curl -s -m 10 "$TELEGRAM_API/bot$BOT_TOKEN/sendMessage" \
            --data-urlencode "chat_id=$CHAT_ID" \
            --data-urlencode "text=$1" > /dev/null
        log "ALERT sent via telegram: $1"
    else
        log "ALERT (telegram not configured): $1"
    fi
}

probe() {
    curl -s -o /dev/null -w "%{http_code} %{time_total}" \
        --connect-timeout "$CONNECT_TIMEOUT" --max-time "$MAX_TIME" "$1" 2>/dev/null
}

check_target() {
    local out code ms
    out="$(probe "$1")"; code="${out%% *}"
    if [[ ! "$code" =~ ^[23] ]]; then
        sleep 2
        out="$(probe "$1")"; code="${out%% *}"
    fi
    [[ -n "$code" ]] || code=000
    ms="$(awk -v t="${out##* }" "BEGIN { printf \"%.0f\", t * 1000 }")"
    if [[ "$code" =~ ^[23] ]]; then echo "UP $code $ms"; else echo "DOWN $code $ms"; fi
}

[[ -r "$TARGETS_FILE" ]] || { log "cannot read $TARGETS_FILE"; exit 2; }
touch "$STATE_FILE" || { log "cannot write $STATE_FILE"; exit 2; }

declare -A prev_state
while IFS="|" read -r key value; do
    [[ -n "$key" ]] && prev_state["$key"]="$value"
done < "$STATE_FILE"

declare -A new_state
ok_count=0; fail_count=0

while IFS=, read -r name url extra || [[ -n "${name:-}" ]]; do
    name="${name//[[:space:]]/}"; url="${url//[[:space:]]/}"
    [[ -z "$name" || "$name" == \#* ]] && continue
    read -r status code ms <<< "$(check_target "$url")"
    if [[ "$status" == UP ]]; then ok_count=$((ok_count + 1)); else fail_count=$((fail_count + 1)); fi
    log "$(printf "%-4s %-12s %-42s %-6s %sms" "$status" "$name" "$url" "$code" "$ms")"
    old="${prev_state[$name]:-new}"
    new_state["$name"]=$status
    if [[ "$old" == UP && "$status" == DOWN ]]; then
        notify "$name is DOWN (HTTP $code) - $url"
    elif [[ "$old" == DOWN && "$status" == UP ]]; then
        notify "$name is back UP (HTTP $code) after being down"
    elif [[ "$old" == new ]]; then
        log "baseline: $name first seen $status, no alert"
    fi
done < "$TARGETS_FILE"

: > "$STATE_FILE"
for key in "${!new_state[@]}"; do echo "$key|${new_state[$key]}" >> "$STATE_FILE"; done

log "check complete: $ok_count up, $fail_count down"
[[ "$fail_count" -eq 0 ]] || exit 1Four design notes worth keeping:
- A failed check retries once after two seconds, so a transient blip does not wake you up.
- The first time a target is seen it is recorded but not alerted. That stops a flood after the monitoring box itself reboots.
- The state file is just
name|UPlines, easy to inspect when you are debugging. - Exit code is 1 if anything is down, which pairs cleanly with cron and systemd timers.
Testing the alert path without spamming your phone
Telegram alerts are awkward to verify: either you message yourself a dozen times or you skip testing and ship broken code. I made TELEGRAM_API an environment variable and pointed it at a 20-line Python stub that accepts POSTs, records the payload, and answers with the same JSON shape as the real API. The notify path then runs end to end offline. If you do not want a stub, leave the token empty: the script prints alerts to stdout instead.
Run one: baseline
First execution. jellyfin and gitea answer, nas-web is refused. All three are new, so the script records them and sends nothing:
2026-11-09 04:23:08 UP   jellyfin     http://127.0.0.1:8091/                     200    0ms
2026-11-09 04:23:08 baseline: jellyfin first seen UP, no alert
2026-11-09 04:23:08 UP   gitea        http://127.0.0.1:8092/                     200    1ms
2026-11-09 04:23:08 baseline: gitea first seen UP, no alert
2026-11-09 04:23:10 DOWN nas-web      http://127.0.0.1:8093/                     000    0ms
2026-11-09 04:23:10 baseline: nas-web first seen DOWN, no alert
2026-11-09 04:23:10 check complete: 2 up, 1 downRun two: gitea dies
I killed the gitea server between runs and executed again. Exactly one alert fires, and nas-web, which is still down, stays silent because its state did not change:
2026-11-09 04:23:23 UP   jellyfin     http://127.0.0.1:8091/                     200    1ms
2026-11-09 04:23:25 DOWN gitea        http://127.0.0.1:8092/                     000    0ms
2026-11-09 04:23:25 ALERT sent via telegram: gitea is DOWN (HTTP 000) - http://127.0.0.1:8092/
2026-11-09 04:23:27 DOWN nas-web      http://127.0.0.1:8093/                     000    0ms
2026-11-09 04:23:27 check complete: 1 up, 2 down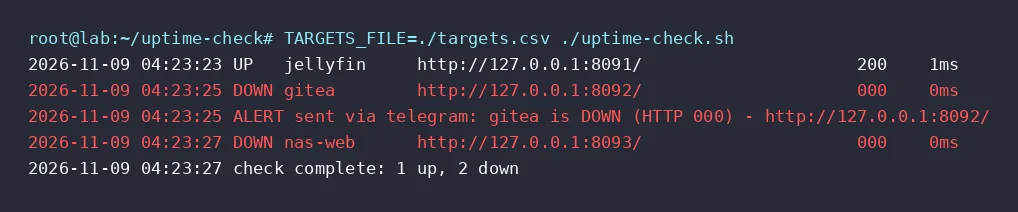
Run three: gitea recovers
Back online. The DOWN to UP transition produces the recovery notice, and the exit code stays 1 because nas-web never came back:
2026-11-09 04:24:06 UP   jellyfin     http://127.0.0.1:8091/                     200    0ms
2026-11-09 04:24:06 UP   gitea        http://127.0.0.1:8092/                     200    4ms
2026-11-09 04:24:06 ALERT sent via telegram: gitea is back UP (HTTP 200) after being down
2026-11-09 04:24:08 DOWN nas-web      http://127.0.0.1:8093/                     000    0ms
2026-11-09 04:24:08 check complete: 2 up, 1 down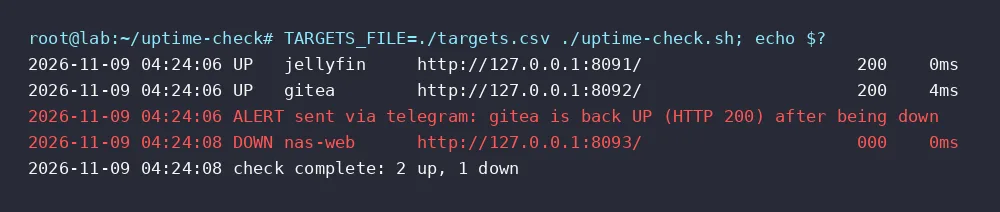
Scheduling with cron
Every five minutes, as a drop-in under /etc/cron.d/. Before adding yet another entry, my cron and systemd timer hygiene audit is a useful detour:
# /etc/cron.d/uptime-check
SHELL=/bin/bash
PATH=/usr/local/sbin:/usr/local/bin:/usr/sbin:/usr/bin:/sbin:/bin

*/5 * * * * root TARGETS_FILE=/etc/uptime-check/targets.csv TELEGRAM_BOT_TOKEN=123456:ABCDEF TELEGRAM_CHAT_ID=-1001234567890 /usr/local/bin/uptime-check.sh >> /var/log/uptime-check.log 2>&1One verification gotcha I hit: piping the run through tee while checking the exit status showed 0 with two targets down, because the pipeline status belongs to tee. With set -o pipefail, or with no pipe at all, the script correctly returns 1.
Settings
| Variable | Default | Notes |
|---|---|---|
| TARGETS_FILE | /etc/uptime-check/targets.csv | name,url lines |
| STATE_FILE | /var/tmp/uptime-check.state | previous status, key|status format |
| TELEGRAM_BOT_TOKEN | empty | alerts print to stdout when unset |
| TELEGRAM_CHAT_ID | empty | use -100… for a group |
| TELEGRAM_API | https://api.telegram.org | point at a local stub to test |
| CONNECT_TIMEOUT | 5 | seconds, curl |
| MAX_TIME | 10 | seconds, curl |
If you want dashboards, history graphs, and thirty notification channels, the Uptime Kuma setup guide is still the right call. For watching five endpoints with zero containers and a phone that only buzzes on a real change, 75 lines of bash is enough. It has run from cron on that box ever since, and gitea has been down twice.