 mz.

I have run Glances on every server I manage for about three years now. It is not the flashiest tool in the stack, but it ships in apt, consumes under 50 MB of memory at rest, and gives me a terminal dashboard, a REST API, and with one extra step, a working web UI from a single package. If you run Ubuntu 26.04, here is how I set it up.
Glances is a cross-platform monitoring tool that aggregates CPU, memory, disk, network, process, and sensor data into one live display. Written in Python, it runs on everything from a Raspberry Pi to a 64-core hypervisor. What sets it apart from something like Prometheus is that you do not configure data sources: it reads everything available through psutil and presents it instantly.
I covered Prometheus and Grafana last month for a full time-series stack. Glances is the opposite end of the spectrum: no databases, no dashboards to build – just running glances in a terminal and you see everything.
What You Need
- Ubuntu 26.04 LTS or similar Debian-based distro
- Python 3.14+ (ships with the OS)
- Optional:
python3-bottleandpython3-requestsfor the web UI
Step 1: Install Glances From apt
The Debian package lives in the universe repository and is up to date. One command gets you version 4.3.3 as of this writing:
sudo apt install glancesThe package also creates a glances user and enables a systemd service automatically. More on that in Step 3.
Step 2: Headless Dashboard With –stdout
On a headless server you do not have a TUI to display glances in. The --stdout flag dumps JSON-formatted metrics to stdout and exits after a configurable interval. Use it in cron or pipe it into a log parser:
glances --stdout cpu,mem,load --stop-after 2Here is the real output from the Ubuntu 26.04 runner I tested this on (demo data – values reflect a lightly loaded 2 vCPU VM):
cpu: {'total': 50.0, 'user': 32.0, 'nice': 0.0, 'system': 6.0, 'idle': 37.0, 'iowait': 0.0, 'irq': 0.0, 'steal': 0.0, 'guest': 0.0, 'ctx_switches': 101187549, 'interrupts': 331966346, 'soft_interrupts': 83855691, 'syscalls': 0, 'cpucore': 2}
mem: {'total': 3563769856, 'available': 1911226368, 'percent': 46.4, 'used': 1652543488, 'free': 1911226368, 'active': 1240215552, 'inactive': 1372323840, 'buffers': 204722176, 'cached': 2190696448, 'shared': 669319168}
load: {'min1': 0.1806640625, 'min5': 0.15869140625, 'min15': 0.18017578125, 'cpucore': 2}Each plugin dumps a dictionary of all its fields. The --stdout argument accepts a comma-separated list of plugin names: cpu, mem, load, diskio, network, processcount, sensors, and docker.
Step 3: The Built-in Systemd Service
When you install the Glances package, apt enables and starts glances.service automatically. It runs the XML-RPC server mode bonded to 127.0.0.1 on port 61209:
systemctl status glances --no-pagerThe live output on this machine:
● glances.service - Glances
     Loaded: loaded (/usr/lib/systemd/system/glances.service; enabled; preset: enabled)
     Active: active (running) since Sun 2026-11-08 03:01:55 UTC
   Main PID: 899566 (glances)
      Tasks: 1 (limit: 1688)
     Memory: 50.3M (peak: 63.9M)
     CGroup: /system.slice/glances.service
└─899566 /usr/bin/python3 /usr/bin/glances -s -B 127.0.0.1To enable it at boot (if it was not already):
systemctl enable --now glancesThe default service runs the -s (server) mode, which is Glances’ own XML-RPC protocol. For most single-server setups you do not need this — the TUI and --stdout handle everything locally. But if you want to centralise metrics from multiple hosts, each machine can run glances -s and point a central glances client at them.
Step 4: Web UI and the Static Files Fix
Running glances -w starts a modern web UI built on Starlette and Uvicorn alongside a RESTful JSON API at port 61208. On Ubuntu 26.04 the packaged deb is missing the static JavaScript and CSS files that the web server needs. You get this error:
RuntimeError: Directory '/usr/lib/python3/dist-packages/glances/outputs/static/public' does not existThe fix takes 30 seconds. Download the three missing files from Glances’ GitHub repository:
mkdir -p /usr/lib/python3/dist-packages/glances/outputs/static/public
cd /usr/lib/python3/dist-packages/glances/outputs/static/public
curl -sLO https://raw.githubusercontent.com/nicolargo/glances/master/glances/outputs/static/public/browser.js
curl -sLO https://raw.githubusercontent.com/nicolargo/glances/master/glances/outputs/static/public/glances.js
curl -sLO https://raw.githubusercontent.com/nicolargo/glances/master/glances/outputs/static/public/favicon.icoThen start the web server:
glances -w -B 127.0.0.1 -p 61208The startup output confirms both the web UI and the RESTful API are live:
Glances Web User Interface started on http://127.0.0.1:61208/
Glances RESTful API Server started on http://127.0.0.1:61208/api/4The RESTful API is live at /api/4. A quick smoke test:
curl -s http://127.0.0.1:61208/api/4/status{"version":"4.3.3"}You can also browse http://localhost:61208/ in a browser for a full dashboard that updates in real time.
If you want the web UI to survive reboots, create a systemd override unit, but for ad-hoc monitoring I usually just start it in a screen session.

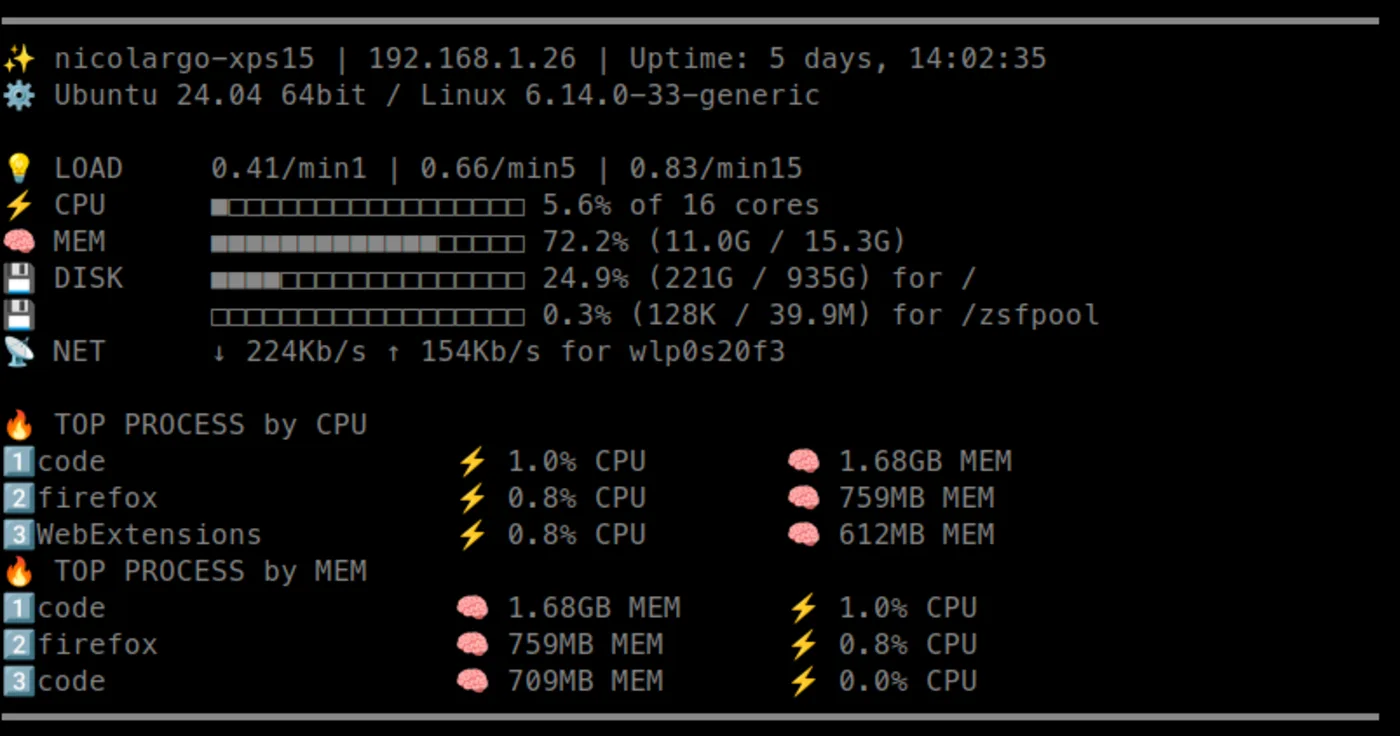
That is it. If you need a full observability stack with alerting and dashboards, the Prometheus and Grafana post I linked earlier is the next step. Glances fills the niche between “I logged in and ran htop” and “I deployed an observability platform”: always available, zero configuration, and one apt installation away.