 mz.

Last week I had to answer “which IPs are hammering my API” at 2am from a 100 MB nginx JSON log, and I wrote it in both jq and Python while waiting. Which one should you actually reach for? Instead of guessing, I seeded a synthetic log and timed every one-liner on the same box.
jq and jq on GitHub – the command-line JSON processor. Python – because you already have it installed.
What you need
- jq 1.6+ (
apt install jq) - Python 3.10+ (already there on Ubuntu)
- A JSON-lines log file, one object per line
The method (and the dataset)
The dataset is synthetic, seeded, and safe to publish: 100,004 lines of JSON-lines access log, 40 of them deliberately corrupted, IPs drawn only from the RFC 5737 TEST-NET ranges (203.0.113.x, 198.51.100.x, 192.0.2.x), status mix weighted like real traffic (85% 200s, 5% 301, 5% 404, 3% 500, 2% 403). Runner: 2 vCPU Ubuntu VM, jq 1.8.1, Python 3.14.4. Each command ran 5 times, I took the median wall time.
python3 - <<'EOF'   # seed the synthetic log (excerpt)
import json, random
random.seed(20261104)
ips=["203.0.113.%d" % random.randint(2,254) for _ in range(400)]
rec={"remote_addr": random.choice(ips), "path": "/api/v1/orders",
     "status": 200, "request_time": round(random.expovariate(8),4)}
EOFRound 1: count requests per status code
The bread-and-butter question: what broke today?
jq
jq -R -r 'fromjson? | .status' /tmp/jqbench/access.jsonl \
  | jq -s -r 'group_by(.) | map({s:.[0], n:length}) | sort_by(-.n)[]
| "\(.s)\t\(.n)"'200 84836
301 5102
404 5008
500 2943
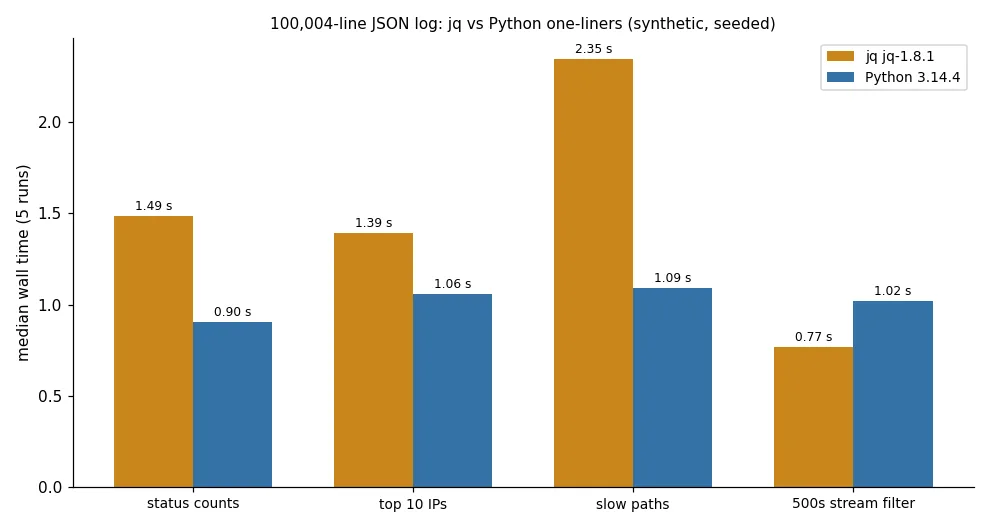
403 20311.49 s (two jq processes piped).
Python
python3 -c "
import json
from collections import Counter
c = Counter()
for l in open('/tmp/jqbench/access.jsonl'):
    try: c[json.loads(l)['status']] += 1
    except Exception: pass
for k, v in c.most_common(): print(k, v)
" 200 84836
301 5102
404 5008
500 2943
403 20310.90 s. First point to Python, and for once the shorter script too.
Round 2: top 10 talkative IPs
jq -Rrn '[inputs | fromjson? | select(type=="object") | .remote_addr]
  | group_by(.) | map({ip:.[0], n:length}) | sort_by(-.n)[:10][]
| "\(.n)\t\(.ip)"' /tmp/jqbench/access.jsonl801 198.51.100.165
791 192.0.2.152
781 192.0.2.43
765 192.0.2.150
765 192.0.2.34
765 203.0.113.149
761 192.0.2.41
740 203.0.113.4
725 203.0.113.83
724 203.0.113.20python3 -c "
import json
from collections import Counter
c = Counter()
for l in open('/tmp/jqbench/access.jsonl'):
try: c[json.loads(l)['remote_addr']] += 1
except Exception: pass
for ip, n in c.most_common(10): print(n, ip)
" 801 198.51.100.165
791 192.0.2.152
781 192.0.2.43
765 203.0.113.149
765 192.0.2.34
765 192.0.2.150
761 192.0.2.41
740 203.0.113.4
725 203.0.113.83
724 203.0.113.20jq: 1.45 s, Python: 1.06 s. Same shape, same winner. Note the -Rrn '[inputs...] trick: read raw lines, parse with fromjson?, slurp once. It beats jq -s on dirty files because a slurp of the whole file dies if any single line is malformed.
Round 3: slowest endpoints
jq -Rrn '[inputs | fromjson? | select(type=="object")]
  | group_by(.path)
  | map({path:.[0].path, avg:([.[].request_time]|add/length), n:length})
| sort_by(-.avg)[:5][] | "\(.avg*10000|round/10000)\t\(.n)\t\(.path)"' /tmp/jqbench/access.jsonl0.121 9946 /api/v1/orders
0.1208 10079 /admin
0.1204 10137 /api/v1/search
0.1201 9944 /api/v1/products
0.1198 9926 /static/app.jspython3 -c "
import json
from collections import defaultdict
d = defaultdict(list)
for l in open('/tmp/jqbench/access.jsonl'):
try:
r = json.loads(l)
d[r['path']].append(r['request_time'])
except Exception: pass
for path in sorted(d, key=lambda p: -sum(d[p])/len(d[p]))[:5]:
print(round(sum(d[path])/len(d[path]), 4), len(d[path]), path)
" 0.121 9946 /api/v1/orders
0.1208 10079 /admin
0.1204 10137 /api/v1/search
0.1201 9944 /api/v1/products
0.1198 9926 /static/app.jsjq: 2.29 s vs Python: 1.09 s. Aggregating numbers inside jq is where it hurts: [.[].request_time]|add/length] builds throwaway arrays per group, while Python’s defaultdict does it natively.
Round 4: stream every 500 out
Different job: no aggregation, just a pass-through filter. This is where jq was born to live.
jq -R -c 'fromjson? | select(.status==500)' /tmp/jqbench/access.jsonl{"@timestamp":"2026-11-02T16:00:47","remote_addr":"198.51.100.207","method":"GET","path":"/.env","status":500,"body_bytes":134105,"request_time":0.054}
{"@timestamp":"2026-11-02T16:00:50","remote_addr":"203.0.113.138","method":"GET","path":"/api/v1/orders","status":500,"body_bytes":100202,"request_time":0.0205}jq: 0.77 s, 2943 matching lines. Python: 1.02 s, same 2943 lines. jq finally wins, and its output keeps the original compact JSON, ready to pipe into the next tool.
The gotcha that cost me an hour
My first pass used the obvious command, no -R, no fromjson?:
jq -c 'select(.status==500)' /tmp/jqbench/access.jsonl | wc -l
# jq: parse error: Expected separator between values at line 322, column 1Plain jq aborts at the first malformed line. Silent killer: in my broken run wc -l reported 6 lines and jq exited 0 through the pipe, so the count was just wrong with no error. Real logs from nginx have corrupt lines. The defensive forms are jq -R 'fromjson? | ...' or jq -Rs never: pick -R 'fromjson?' and the bad lines are skipped, exactly like Python’s try/except. Both numbers in this post came from error-skipping commands, so the comparison is fair.
Head to head
| Task | jq 1.8.1 | Python 3.14 |
|---|---|---|
| Status counts | 1.49 s | 0.90 s |
| Top 10 IPs | 1.45 s | 1.06 s |
| Slowest endpoints | 2.29 s | 1.09 s |
| Stream-filter 500s | 0.77 s | 1.02 s |
| Handling corrupt lines | needs -R 'fromjson?', aborts by default | try/except, one line |
| One-liner ergonomics | wins: no boilerplate, -r/-c output flags | string quoting in -c gets ugly fast |
| Deep slicing / reformatting | wins: group_by, map, path syntax | write a dict comprehension |
| Heavy aggregation (avg, sum by group) | loses: forces slurp + temp arrays | wins: stdlib collections |
Verdict
If your log wrangling is a single filter or a shape transform you will fire from the shell all day, pick jq: fastest stream pass (0.77 s vs 1.02 s here), zero boilerplate, and composable with grep and sort. If the question ends in “average”, “group by”, or your log is dirty and the answer must be right, pick Python: it won three of four benchmarks and its try/except line swallows corrupt entries with less thinking. My honest 2am answer: jq to slice, Python to summarize. Which of these one-liners you keep in muscle memory depends on how you found this post, so if you want the plain-text (not JSON) version of the same tricks, my Nginx Access Log Analysis with Bash and Python covers awk and grep. For latency hunting at the database layer see Enable Slow Log on MySQL/MariaDB, and when the log itself is eating your disk, this Docker log rotation script is the fix.