 mz.

Hi, I was rebuilding the monitoring corner of my homelab this month and I kept coming back to one question: what do you run when you want something boring in the best sense of the word? I landed on Nagios Core. The project is more than 30 years old, it quietly powers half the monitoring stacks I see in government pentest engagements, and it shipped version 4.5.14 in August 2026, so it is nowhere near finished. Here is the install I did on a clean Ubuntu 24.04 server, start to finish.
Sources: Nagios Core | GitHub (Core) | GitHub (Plugins) | Official source install doc
What you are actually installing
Nagios Core is a scheduler plus a status web UI. The daemon wakes up on a timer, runs small check programs called plugins, and stores the results. The browser side is CGI scripts under Apache. Nothing is fancy, which is exactly why it has survived three decades: every piece is a plain file you can read.
| Component | What it does |
|---|---|
| nagios daemon | Schedules checks, evaluates rules, sends alerts |
| Nagios Plugins | The actual probes: check_ping, check_disk, check_http |
| CGIs | Render the status pages under Apache |
| Apache + PHP | Serves the web interface and the statuswrl map |
Requirements
- A server or VM with Ubuntu 24.04 LTS, 1 vCPU and 1 GB RAM is plenty to start
- A sudo user and outbound internet access (we build from source)
- Port 80 open to wherever you will browse from
Step 1: Install the prerequisites
Build tools, the GD library for the status maps, Apache with PHP, and OpenSSL headers, which have been a hard requirement since Core 4.4.7:
sudo apt update
sudo apt install -y autoconf gcc libc6 make wget unzip apache2 php \
libapache2-mod-php libgd-dev openssl libssl-dev ufwStep 2: Download and compile Nagios Core
Grab the latest release from GitHub. At the time of writing that is 4.5.14:
cd /tmp
wget -O nagioscore.tar.gz \
  https://github.com/NagiosEnterprises/nagioscore/archive/refs/tags/nagios-4.5.14.tar.gz
tar xzf nagioscore.tar.gz
cd nagioscore-nagios-4.5.14
sudo ./configure --with-httpd-conf=/etc/apache2/sites-enabled
sudo make allRead the configure summary before you run make, it tells you where everything will land and which optional features it found or missed.
Step 3: Install the engine
Five make targets, each doing one small job:
sudo make install-groups-users
sudo usermod -a -G nagios www-data
sudo make install
sudo make install-daemoninit
sudo make install-commandmode
sudo make install-config| Command | What it does |
|---|---|
| make install-groups-users | Creates the nagios user and group |
| usermod -a -G nagios www-data | Lets Apache submit external commands |
| make install | Binaries, CGIs and HTML into /usr/local/nagios |
| make install-daemoninit | Registers the systemd service |
| make install-commandmode | Sets permissions on the external command file |
| make install-config | Installs sample configs so Nagios can start |
Step 4: Wire up the web interface
sudo make install-webconf
sudo a2enmod rewrite
sudo a2enmod cgi
sudo htpasswd -c /usr/local/nagios/etc/htpasswd.users nagiosadmin
sudo systemctl restart apache2The htpasswd command prompts for a password, that is your web login, and note the nagiosadmin account is just another user until you map it in authorization.cfg. When you add more users later, drop the -c flag or you will overwrite the whole file.
Step 5: Firewall and start
sudo ufw allow Apache
sudo ufw reload
sudo systemctl enable --now nagios
systemctl status nagios --no-pagerYou should see active (running) with the Nagios process listening in the log tail.
First login
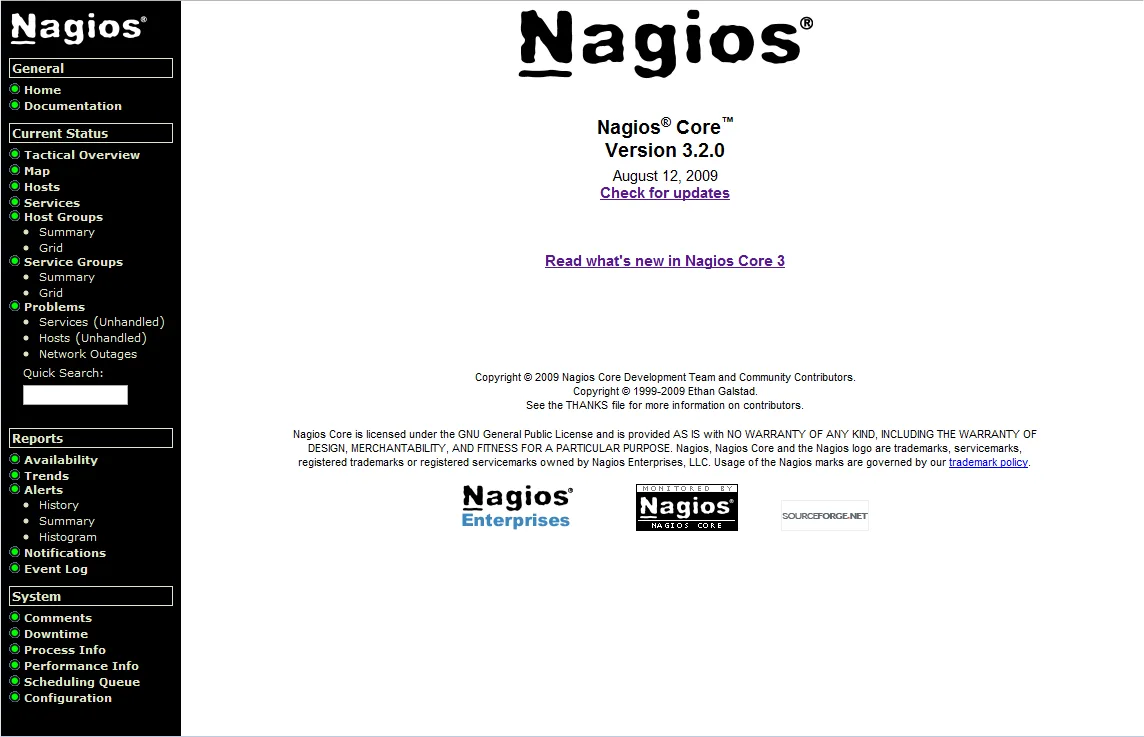
Open http://YOUR-SERVER-IP/nagios, log in as nagiosadmin, and you get the status grid. On a fresh install only localhost is monitored: ping, disk, swap, load, users, procs.
But wait: the errors are normal
Click any service and you will hit this wall:
(No output on stdout) stderr: execvp(/usr/local/nagios/libexec/check_load, ...)
failed. errno is 2: No such file or directoryCore ships with zero working probes. That errno 2 means the plugin binaries do not exist yet. Time to build them.
Step 6: Install the Nagios Plugins
sudo apt install -y autoconf gcc libc6 libmcrypt-dev make libssl-dev \
  bc gawk dc build-essential snmp libnet-snmp-perl gettext iputils-ping

cd /tmp
wget -O nagios-plugins.tar.gz \
  https://github.com/nagios-plugins/nagios-plugins/releases/download/release-2.5/nagios-plugins-2.5.tar.gz
tar zxf nagios-plugins.tar.gz
cd nagios-plugins-release-2.5
sudo ./configure
sudo make
sudo make installEvery probe lands in /usr/local/nagios/libexec/. Do not restart anything, Nagios picks up new plugins on the next scheduled check.
Verify everything
# config sanity check before you touch anything else
/usr/local/nagios/bin/nagios -v /usr/local/nagios/etc/nagios.cfg

# confirm the probes exist
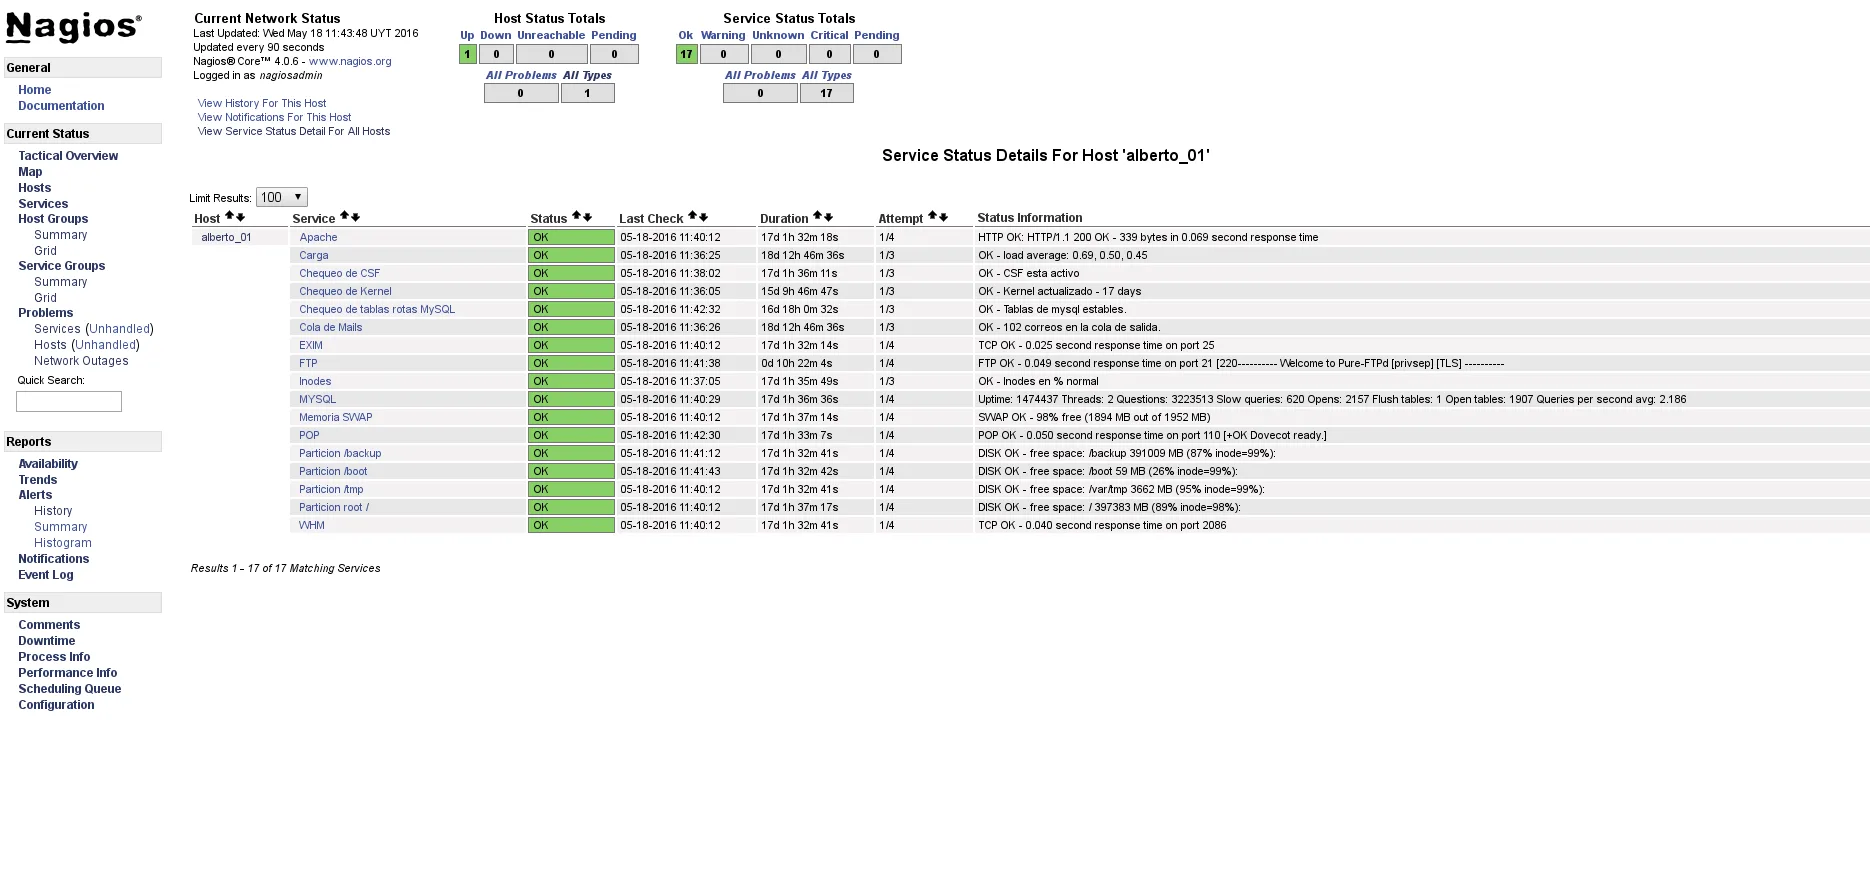
ls /usr/local/nagios/libexec/ | headBack in the web UI, open any service and use Re-schedule the next check under Commands. The errno 2 text is replaced with real output, and the status map finally fills with green.
Monitoring a second host
Create /usr/local/nagios/etc/objects/nagioshosts.cfg and register the file inside objects.cfg with a cfg_file= line. A minimal router check looks like this:
define host {
    use             generic-host
    host_name       edge-router
    alias           Office edge router
    address         192.168.1.1
    check_command   check-host-alive
    max_check_attempts 5
    notification_period 24x7
}

define service {
    use                 generic-service
    host_name           edge-router
    service_description HTTPS
    check_command       check_tcp!443
}Run the nagios -v config check again, then sudo systemctl reload nagios. The host appears within one check interval.
Gotchas I hit so you don’t have to
| Symptom | Cause and fix |
|---|---|
| Status pages show empty tables | You skipped usermod -a -G nagios www-data, re-run it and restart Apache |
| 404 on /nagios | The webconf was not installed or a2enmod cgi was missed |
| Login works, commands fail with “could not open command file” | Missing make install-commandmode |
| check_http returns (null) | Build plugins with curl dev headers installed, apt install libcurl4-openssl-dev, then re-run configure and make |
Nagios is not going to win a beauty contest against Grafana, and I did not install it for the aesthetics. I installed it because I can trace any alert from the status page to a text file to a shell command in under a minute, and that debugging story still matters more to me than dashboards. If you run a homelab or a small production fleet, one afternoon with this stack is worth it.